Performance Testing — 24h University-Scale Load + Soak Plan
Status: design spec for the
perf/suite. The harness this document describes has shipped (the top-levelperf/directory — controller, setpoint bus, phase engine, device-fleet orchestrator, generators, seeder, war-room poller, manifests, and thespddi-perf tuiconsole); this remains the authoritative design reference for what it does and how to run it — detailed enough to operate or extend without re-deriving anything. It is deliberately not added to theCLAUDE.mddocument map; it is a standalone plan.What this is. A complete plan for a 24-hour load + soak test of the whole SpatiumDDI suite (DHCP via Kea, DNS via BIND9, IPAM control plane on FastAPI + Postgres) modeling a large university (~50k students, 200k–300k unique devices seen across a busy day) against a single-node clean appliance.
Every threshold in this document is marked
[tune-after-baseline]unless it is a structural invariant (zero deadlocks, zero pod restarts, zero Redis evictions). The absolute latency/leak numbers are principled starting points to be re-derived from the first baseline/smoke run (§8.3.1, §10).
Table of contents
- 0. Goals, non-goals & locked decisions
- 0.A Canonical numbers (the single source of truth)
- 1. Scenario model & workload math
- 2. Test target & topology
- 3. DHCP load generator
- 4. DNS load generator
- 5. Control-plane & DB bottleneck analysis + ready mitigations
- 6. Real-time monitoring / war-room
- 7. 24h bake-in harness & orchestration
- 8. Metrics collection & end-of-run reporting (SLO pass/fail)
- 9. Repo layout + ordered build plan
- 10. Open questions for the operator
0. Goals, non-goals & locked decisions
Goals
- (a) DB never bottlenecks — prove the single CNPG instance survives a university-scale 24h soak: no connection-pool saturation, no lock/deadlock contention, no runaway write amplification, autovacuum keeps up, no unbounded bloat.
- (b) End-to-end latency SLOs — DHCP ACK p50/p95/p99, DNS resolve p99, and the cross-domain lease → IPAM → DNS propagation lag stay within budget.
- (c) Max sustainable throughput discovery — ramp past steady-state to find the ceiling and name which component gives out first.
- (d) 24h soak stability — no leaks, no Celery/Redis queue backlog growth, no pod restarts, metric/log retention pruning keeps up.
All four criteria are reported on for every headline run; §8.3 is the single consolidated pass/fail gate.
Non-goals
- Not multi-node HA. This is single-node only. Where single-node materially
differs from HA (read offload to a CNPG replica;
dns_record_opfan-out multiplying by DNS-server count) it is noted inline, but HA is not tested here. - Not docker-compose. The target is the k3s all-in-one appliance.
- Not a recursive-resolver test. BIND is authoritative-only for the managed zones (recursion OFF, closed-loop — §4.1, §4.9). Recursive load is a separate test design.
- Not a product-feature test. Integrations, webhooks, conformity, device profiling are OFF for the baseline (§7.6.5).
Locked decisions (design to these; do not relitigate)
| # | Decision |
|---|---|
| L1 | Test target = single-node CLEAN APPLIANCE (k3s AIO VM): CNPG single-instance, Redis single (sentinel kind, 1 replica), bind9 + kea as hostNetwork DaemonSets, api/worker/beat = 1 each. |
| L2 | Load tooling = HYBRID — perfdhcp (Kea/Debian pkg) + dnsperf/resperf/flamethrower for raw-protocol throughput floors, plus a custom Python asyncio orchestrator modeling the realistic 24h device lifecycle (staggered arrivals, DORA, T1/T2 renewals, DNS query bursts, DDNS + lease→IPAM write pressure). |
| L3 | All four success criteria above must be exercised and reported. |
| L4 | Scale = ~50k students; 250k unique devices headline (300k stretch ceiling lever); diurnal curve (morning surge etc.), not a flat blast. |
One framing that drives the entire design
The recon verdict, verified against the codebase: the throughput ceiling is a
DB/ingestion ceiling, not a protocol ceiling. Kea’s lease store is a local
memfile CSV (render_kea.py:624), and BIND answers authoritative queries
from in-memory zone files — neither touches Postgres on the hot path. All
DB pressure is indirect, generated by the agents tailing daemon state and
POSTing it back to the control plane (POST /dhcp/agents/lease-events,
POST /dns/agents/*). So:
perfdhcp/dnsperfestablish the protocol floor (Kea ACK p99, BIND resolve p99) — proving the protocol tier is not the limiter.- The custom orchestrator establishes the real ceiling = the control-plane ingestion + single CNPG instance.
The two ceilings are two separate numbers measured independently.
0.A Canonical numbers (the single source of truth)
Every other section and every run manifest references these by symbol. The recon traced a critical fact the early drafts got wrong, now corrected here and propagated everywhere: Kea’s
renew-timeris HARDCODED to 900s (agent/dhcp/spatium_dhcp_agent/render_kea.py:641→renew-timer: 900,rebind-timer: 1800), independent ofvalid-lifetime(lease time). A per-subnet override key exists (render_kea.py:423-426readssubnet["renew_timer"]) but no IPAM Subnet / DHCP Scope model field populates it (grep ofbackend/app/models/{ipam,dhcp}.py= zero hits). So in every realistic config, T1 = 900s for every device regardless of lease time — and renewal write-pressure is constant per online device, dominated by the 15-minute renew cadence, not the lease length.Pre-flight assertion (Phase 0, §9): dump the rendered
kea-dhcp4.confon the test appliance and confirmrenew-timer:900before trusting any renew/s number. The whole DB write budget rests on it.
Population symbols
| Symbol | Meaning | Headline value | Stretch / variant |
|---|---|---|---|
D_total |
Unique devices seen across 24h | 250,000 | 300,000 (ceiling cut) |
D_online(t) |
Devices holding an active lease at t |
diurnal, peak 150,000 | — |
D_online_floor |
Overnight floor (03:00–05:00) | 52,000 | — |
D_active_dns(t) |
Devices actively emitting DNS at t |
subset, peak ~120,000 | — |
D_total splits ~150k resident (come-and-go, renew all day) + ~100k
transient/one-shot (single lease window, no renewals — they load the
write-amplifying first-lease path harder per device).
Rate symbols (the numbers the DB must survive)
| Symbol | Definition | Steady peak (08:00) | Trough (03:00) | Ceiling push |
|---|---|---|---|---|
λ_dora |
First-lease DORA/sec (wire) | 12.5 | 0.2 | dial to 30+ |
λ_renew |
Renewals/sec = D_online / 900 |
166.7 (150k/900) | 57.8 (52k/900) | ~278 (250k online) |
λ_lease_events |
lease-events/sec → DB = λ_dora + λ_renew |
~179 | ~58 | storm: dial to 300+ |
λ_ddns |
First-time DDNS publishes/sec (arrivals only) | 12.5 | 0.2 | 30+ |
λ_dnsq |
Sustained DNS qps (curve value) | 18,000 | ~1,040 | n/a |
λ_dnsq_burst |
Raw-protocol burst ceiling (dnsperf/resperf) | — | — | ramp to 100k–150k |
λ_expire |
Lease expiries/sec | bursty | low | bursty overnight |
λ_apimut |
Operator-API mutations/sec (audit-lock stream) | 2–5 | ~0 | burst 50 (separate ramp) |
Correction propagated from the critique (C1/A1). Earlier drafts derived
λ_renewfromT1 = lease/2(3600s → ~42/s), which is ~4× too low. The correct steady renewal floor isD_online / 900: ~167/s at 150k, ~278/s at 250k online. The per-second DB write budget below uses 900s.
Lease-time, address-space, zone shape (profile axes)
| Knob | Headline | Variant(s) | Note |
|---|---|---|---|
lease_time |
7200s (2h) | 3600s (1h ceiling lever); 86400s (24h stale-row soak) | Lease time affects expiry/reap + pool occupancy + stale-row accumulation only — not renewal pressure (constant at 900s). DHCPScope.lease_time default = 86400 (models/dhcp.py:325); the headline overrides it to 7200. |
| Address space | 8 × /16 under 10.0.0.0/8 (≈524k usable, ~90% pools ≈472k) |
256 × /22 (subnet-scan stress, §1.7) | No prefix floor, no v4 pool size cap (pools.py); one pool spans a /16 (render_kea.py:299). |
| Reverse-zone shape | 8 per-octet N.10.in-addr.arpa (spreads PTR serial-bump contention) |
single 10.in-addr.arpa (labeled H3 hot-row-stress variant) |
Single-zone works via longest-suffix match (_resolve_reverse_zone, router.py:806-844) but forces all PTR serial bumps onto one dns_zone row = maximal hot-row contention. Make it an explicit profile axis — do not let the single zone be an accidental default. |
| DDNS policy | always_generate (max write volume, deterministic dhcp-<3rd>-<4th> names) |
client_or_generated (realistic names) |
disabled zeroes the DNS write path — never on test subnets. |
query_log_enabled |
OFF | ON in a bounded firehose sub-run only | The single largest row driver; confounds the DB ceiling if left on (§4.4, §5.4). |
ddns_enabled |
ON | OFF (isolate the bare lease firehose) | The DDNS toggle drives the dns_record/dns_record_op/dns_zone-serial write path. |
| Operator-mutation stream | ON in the headline run (2–5/s) | dedicated audit-contention ramp variant | Folded into the headline so criterion (a)’s lock dimension is actually answered (§1.6, §5 H1). |
| DHCP topology | relay/giaddr (campus realism, multi-subnet) OR direct-broadcast single-VLAN v1 fallback | — | Phase-0 decision (§3.1.2) — it changes Kea’s dhcp_socket_mode (relay→udp vs direct→raw) at seed time. |
Per-second DB write budget at the 08:00 steady peak
Derived from the verified per-event write-amplification map (§5.2), corrected for the 900s renew model and the verified renewal short-circuits:
lease-events  ~179/s  → ~179 dhcp_lease UPDATE/INSERT/s
                        (λ_dora=12.5 INSERT + λ_renew=166.7 UPDATE)
                      → ip_address mirror: ~12.5/s (DORA INSERT only;
                        renewals ELIDE the mirror UPDATE — stable hostname/MAC,
                        SQLAlchemy dirty-tracking, agents.py:866-871 + §5.2 fn3)
first-DDNS    12.5/s  → 25.0/s dns_record INSERT (A+PTR)
                      + 25.0/s dns_record_op INSERT (1 op/record/agent-server)
                      + 25.0/s dns_zone.last_serial UPDATE  ← HOT ROW
expiry/sweep  (300s)  → batched per-departure history INSERT + IPAM DELETE +
                        DDNS-revoke cascade (2 DELETE dns_record + 2 op + 2 serial)
operator stream 2-5/s → audit_log INSERT + global advisory-lock acquisition
────────────────────────────────────────────────────────────────────────────
≈ 230 row-mutations/sec of "device" write traffic (dominated by the ~167/s
dhcp_lease renewal UPDATE floor), + DDNS hot-row UPDATEs, + 60s beat-sweep
reads + the operator-mutation stream — all on ONE 1-CPU CNPG instance with
shared_buffers=256MB and no read replica. Renewal-storm push: ~300+/s.
Earlier drafts cited ~105/s; the corrected steady budget is ~230/s, and the renewal storm (§1.5) pushes the lease-events ingest to 300+/s. This is the central number all four criteria are judged against.
Predicted failure order under the ceiling push (record which actually gives
first):
(1) dns_query_log_entry ingestion + autovacuum — only if query-log ON;
(2) dns_zone.last_serial hot-row UPDATE contention as first-DDNS rate
climbs (H3, the most likely first-to-give in the qlog-OFF headline run);
(3) the per-POST full subnet scan (only with the 256-subnet variant);
(4) connection-pool exhaustion once the operator stream is layered on;
(5) the audit advisory-lock single-writer choke (operator-stream-only).
1. Scenario model & workload math
Turns “50k students / 200–300k devices / heavy DNS” into concrete per-second generator targets. Every figure shows its arithmetic and is grounded against the codebase. All rate/zone/lease symbols are defined in §0.A.
1.1 Three populations, kept distinct
Casual “50k students” talk conflates three things; the generators target
different ones — see §0.A. The headline run is sized to D_total = 250,000
(realistic mid-point), with a 300,000 stretch lever for the ceiling cut. The
protocol generators are cheap to dial up; the binding constraint is always the
control-plane ingestion + single CNPG instance, so the device-count knob mostly
moves lease-events POST rate and DDNS write rate — exactly criterion
(a)/(c) territory.
Grounding on what hits the DB. Kea’s lease store is a memfile CSV — raw DHCP
ACK throughput does not touch Postgres. DB pressure is entirely indirect, via
the agent tailing that CSV and POSTing /dhcp/agents/lease-events (every DORA
and every T1/T2 renewal), which upserts a dhcp_lease row + mirrors an
ip_address row + (first time only) fires DDNS A+PTR. The numbers that matter
for the DB are lease-events/sec and first-time-DDNS/sec, not raw DORA/sec
at the wire.
1.2 Why diurnal, not flat
The brief is explicit: staggered/parallel over 24h, a diurnal curve with morning surge — not a flat blast. A flat blast would (a) never exercise the renewal storm (every device renewing in a tight window after a mass re-attach), and (b) never let us watch autovacuum recover during the overnight trough — both core to criterion (d).
1.3 The hourly diurnal curve (the master schedule)
Shape: overnight floor → 06–09 arrival surge → mid-morning plateau → lunch
dip-and-recover → afternoon plateau → late-afternoon departure → evening dorm
peak → overnight decay. Arrivals are new lease events; online count is the
integral of (arrivals − departures). Renew/sec uses the verified 900s renew
cadence (D_online / 900), not lease/2.
| Hour | Phase | Arriving this hr | D_online (end) |
DORA/s | Renew/s (=D_online/900) | lease-events/s →DB | DNS qps |
|---|---|---|---|---|---|---|---|
| 00:00 | overnight | 1,500 | 60,000 | 0.4 | 66.7 | 67.1 | 1,200 |
| 01:00 | overnight | 1,000 | 56,000 | 0.3 | 62.2 | 62.5 | 1,120 |
| 02:00 | overnight | 800 | 53,000 | 0.2 | 58.9 | 59.1 | 1,060 |
| 03:00 | trough | 600 | 52,000 | 0.2 | 57.8 | 58.0 | 1,040 |
| 04:00 | trough | 800 | 52,000 | 0.2 | 57.8 | 58.0 | 1,040 |
| 05:00 | pre-surge | 2,500 | 55,000 | 0.7 | 61.1 | 61.8 | 1,200 |
| 06:00 | surge ramp | 12,000 | 70,000 | 3.3 | 77.8 | 81.1 | 2,800 |
| 07:00 | SURGE | 35,000 | 105,000 | 9.7 | 116.7 | 126.4 | 9,000 |
| 08:00 | SURGE peak | 45,000 | 145,000 | 12.5 | 161.1 | 173.6 | 18,000 |
| 09:00 | plateau | 18,000 | 150,000 | 5.0 | 166.7 | 171.7 | 16,000 |
| 10:00 | plateau | 8,000 | 150,000 | 2.2 | 166.7 | 168.9 | 15,000 |
| 11:00 | plateau | 7,000 | 149,000 | 1.9 | 165.6 | 167.5 | 15,000 |
| 12:00 | lunch dip | 6,000 | 142,000 | 1.7 | 157.8 | 159.5 | 13,000 |
| 13:00 | lunch recover | 14,000 | 148,000 | 3.9 | 164.4 | 168.3 | 14,000 |
| 14:00 | plateau | 9,000 | 150,000 | 2.5 | 166.7 | 169.2 | 16,000 |
| 15:00 | plateau | 7,000 | 148,000 | 1.9 | 164.4 | 166.3 | 15,000 |
| 16:00 | departure | 5,000 | 130,000 | 1.4 | 144.4 | 145.8 | 12,000 |
| 17:00 | departure | 4,000 | 110,000 | 1.1 | 122.2 | 123.3 | 9,000 |
| 18:00 | dorm peak ramp | 16,000 | 125,000 | 4.4 | 138.9 | 143.3 | 13,000 |
| 19:00 | EVENING peak | 14,000 | 135,000 | 3.9 | 150.0 | 153.9 | 17,000 |
| 20:00 | evening | 9,000 | 130,000 | 2.5 | 144.4 | 146.9 | 15,000 |
| 21:00 | evening | 6,000 | 120,000 | 1.7 | 133.3 | 135.0 | 12,000 |
| 22:00 | wind-down | 4,000 | 100,000 | 1.1 | 111.1 | 112.2 | 7,000 |
| 23:00 | wind-down | 2,500 | 80,000 | 0.7 | 88.9 | 89.6 | 4,000 |
| Σ/day | ≈253,000 | (peak 150k) | — | — | — | — |
Sum check. Σ arrivals ≈ 253,000 ≈ D_total; running D_online is the
integral of arrivals minus departures (departures implicit in the falling online
count, e.g. 15:00→16:00 drops 18k). Note the renewal floor never drops below
~58/s even overnight — the soak-stability stream that proves the box isn’t
leaking while load is low.
1.4 The two stress windows the curve deliberately creates
- 08:00 SURGE peak — max first-lease DORA (12.5/s) stacked on the renewal
floor (~161/s) stacked on the DNS qps peak (18k). Worst moment for the
lease→IPAM→DNS write fan-out and the DNS
/configwake-storm (each DDNS-touching lease-events batch publishes adns_groupwake → the parked DNS long-poll re-materializes the whole DNS group’s record set — §4.6, reconconfigbundle-poll.md). - Overnight trough (03:00–05:00) — load drops to the floor so we can watch
autovacuum catch up on
dhcp_lease/ip_address/dns_record/dns_zoneand the daily log-prune land without contending with peak traffic. If dead-tuple counts and bloat do not recede here, the soak is failing.
1.5 The renewal storm (criterion-(c) lever)
A synchronized renewal burst the morning after a network blip, or simply the clustered 07:00 arrival cohort whose T1 (900s) timers cluster ~15 min later:
- The 07:00 cohort of 35,000 devices took leases in a ~30-min window. Their T1 (900s) fires ~15 min later in a correspondingly tight window.
- Storm renew rate from the cohort alone ≈ 35,000 / 1800 = 19.4/s on top of the ~161/s baseline → ~180/s sustained for the surge window, with sub-minute spikes the orchestrator can dial to 300/s to probe the ceiling.
- Agent batch math (
leases.py:32-33: flush 100 events OR 5s, buffer cap 5000, half-drop on overflow): at 180/s the agent fills a 100-event batch every ~0.56s, flushing on count well inside the 5s timer. The 5000 buffer would only fill on a sustained ingestion stall of 5000/180 ≈ 28s. At a 300/s storm push the buffer fills in ~17s of total stall. This is the designed pressure point for criterion (c): ramp the storm until (i) lease-events POST p99 climbs, (ii)lease_events_buffer_trimmedfires, or (iii) CNPG conn count / pool checkout-wait spikes — and record which gives first.
1.6 The parallel operator-API mutation stream (required for criterion (a))
The pure device-lifecycle load writes ZERO audit rows — verified, by design
(agents.py lease path never calls write_audit; the omission is documented at
agents.py:1097-1105). So it never touches the audit hash-chain advisory lock
(audit_chain.py:153, pg_advisory_xact_lock(0x4144495441554449), held to
COMMIT) and never contends on the operator-write path. To actually exercise
criterion (a)’s lock/deadlock dimension the orchestrator must run a parallel
stream of authenticated operator-API mutations:
- Bursts of bulk-allocate (
POST /ipam/subnets/{id}/bulk-allocate/commit, cap 1024/call), IP edits, zone/record CRUD, subnet tag/CF bulk edits — each writes anaudit_logrow → each acquires the global advisory lock to COMMIT. Modeled rate: 2–5 mutations/sec sustained, bursting to ~50/s in the ceiling window.
Decision (applying critique M5): the operator-mutation stream is folded
INTO the headline run at 2–5/s, so all of criterion (a) is answered in one cut.
A separate audit-contention variant ramps the stream to its own ceiling
(criterion (a)’s effective lock ceiling ≈ 1 / mean-audited-txn-hold-time — itself
a throughput question worth discovering, critique gap c-i). If a future profile
runs without the stream, the report must explicitly say “audit-lock contention:
NOT EXERCISED” so a PASS isn’t misread.
1.7 DNS workload shape
Per-device query rate (the load-bearing assumption). Active-DNS device ≈ 1.0 qps sustained average; idle-online device ≈ 0.1 qps. The per-device model establishes the shape; the 18,000 qps sustained busy-hour peak is a stated input (a defensible campus busy-hour average — validate against real campus resolver stats, §10), separate from the ~120k qps short-burst ceiling the dnsperf/resperf raw-protocol phase drives. (The naive per-device product — 116k active × 1.0 + 29k idle × 0.1 ≈ 118.9k — is the theoretical instantaneous ceiling, not a sustained average; we do not gate against it.) Two numbers, both kept: sustained 18k peak / ~1k trough runs all 24h; the bounded burst phase answers “how fast can BIND itself go.”
Query-type mix & where it lands. BIND is authoritative-only (recursion OFF, §4.1). The query set is generated from the orchestrator’s own allocation ledger so ≥95% hits real records:
| Qtype | Share | Target | Expected RCODE |
|---|---|---|---|
| A | 55% | DDNS forward names + seeded host names | NOERROR (leased) / NXDOMAIN (cold tail) |
| AAAA | 10% | same forward names (v6 subnets) | NOERROR / NOERROR-empty |
| PTR | 20% | in-addr.arpa for leased IPs |
NOERROR (leased) / NXDOMAIN |
| SRV | 5% | seeded _ldap._tcp, _kerberos._udp, _sip._tcp |
NOERROR |
| MX + TXT | 5% | seeded mail, SPF/DKIM |
NOERROR |
| SOA + NS | 3% | zone apexes | NOERROR |
| deliberate-miss A | 2% | random labels UNDER a seeded zone | NXDOMAIN only |
Critique H4 fix. All “miss” names must be random labels under a seeded zone (so recursion-off BIND returns authoritative NXDOMAIN). A name not under any seeded zone returns REFUSED — that is a query-set bug / leak attempt, not an intended miss. REFUSED is an explicit, zero-expected RCODE counter in the metrics (§4.8, §8.3 b6a). The Zipfian popularity (
s≈1.0) makes the top ~1% of names absorb ~50% of queries (real campus shape).
query_log_enabled decision. OFF for throughput/ceiling runs (BIND answers
from memory; turning it on makes every query a dns_query_log_entry INSERT — at
18k qps ≈ 360M rows/day). ON only in a bounded firehose sub-run (e.g. 5,000
qps for ~3h ≈ 54M rows) to measure ingestion + the once-daily 24h-retention bulk
DELETE — not the catastrophic ~1.5B-row full run.
1.8 24h master timeline
Times are test-clock hours from start (T+), mapped to local clock by starting at local 00:00 so the natural surge falls at T+7..T+8.
| Window | T+ (h) | What runs | Criterion | Pass signal |
|---|---|---|---|---|
| 0. Pre-flight | −1..0 | seed scaffold, enable roles, enable pg_stat_statements (restart), capture idle baseline, clock-skew + recursion-leak + in-zone-coverage gates (§4.9, §7.5.1) |
— | all /health/platform green; idle conns < 20; dead_tup ~0; NTP offset < 50ms; recursion REFUSED locally |
| 1. RAMP | 0..5 | overnight floor (52–60k online), renew ~58/s, DNS ~1k qps; bring devices online gradually; let autovacuum settle | (d) baseline | flat dead_tup, no queue growth |
| 2. SURGE | 5..9 | arrival ramp → 08:00 peak (DORA 12.5/s, renew ~161/s, lease-events ~174/s, DNS 18k); renewal storm burst at T+8 (dial to 300/s ≤30 min) | (b) peak latency; (c) first probe | DHCP/DNS p99 within SLO; lease-events p99 stable; no buffer trim |
| 3. STEADY | 9..16 | plateau 150k online, renew ~167/s, DNS 15–16k, lunch dip/recover; operator stream 2–5/s | (a) sustained; (d) | conns/pool stable; cache-hit steady; autovacuum bounding dead_tup; no dns_zone lock waves |
| 4. PEAK / ceiling | 16..17 | hold 150k but ramp DNS toward 100–150k qps; drop lease to 1h; inject 300/s storm; ramp operator stream to 50/s | (c) max throughput + first-to-give | identify the first-to-saturate component |
| 5. EVENING peak | 17..21 | departure → dorm re-attach → 19:00 peak (DORA 4/s, renew ~150/s, DNS 17k) | (b) second window; (a) | SLOs hold again; DB recovered from T+16 push |
| 6. SOAK / overnight | 21..24 | wind-down to floor; daily log-prune + lease-sweep + autovacuum recovery; fault-injection mini-phase (§7.6.6) | (d) soak | dead_tup recedes; prune completes; Redis flat; no restarts; queues → ~0; agents serve from cache through the injected blip |
| 7. Query-log firehose | overlay (own run, not headline) | flip query_log_enabled=ON at bounded 5k qps |
(d) dns_query_log_entry growth + daily DELETE |
ingestion keeps up; prune lands; bloat reclaimed |
1.9 Short smoke variant (30–60 min) — and the baseline-tuning gate
A compressed run validating the whole harness (generators reach the box, agents ingest, war-room populates, SLO math computes) before committing 24h. Same phase engine + manifest schema, scale-compressed:
| Window | min | What runs |
|---|---|---|
| Seed + baseline | 0–5 | single /16 + pool + fwd + 1 reverse zone; enable roles; war-room green |
| Ramp | 5–15 | 5,000 devices online (DORA ~8/s), renew builds |
| Mini-surge | 15–25 | +5,000 arrivals in 5 min + DNS to 3,000 qps + 60/s lease-events storm for 2 min |
| Mini-ceiling | 25–35 | dnsperf ramp to 20k qps; lease 30 min to force renews; watch which panel moves; measure generator capacity (perfdhcp clients/proc, orchestrator devices/proc) |
| Mini-soak | 35–55 | hold 10k devices; trigger the daily prune manually to confirm the DELETE path |
| Teardown check | 55–60 | dead_tup recedes, queues drain, no restarts |
The smoke run is a HARD, GATED predecessor to the 24h run (critique b-i, F-phase). It owns three things the 24h run depends on:
- Generator-capacity calibration (critique C4/G1): measure max stable clients/proc for perfdhcp and max stable devices/proc for the orchestrator (watch scheduler-lag). Compute shard/box counts from measured capacity. The 24h run does not start until the smoke proves the fleet sustains the morning-surge peak offered rate without generator-side saturation.
- Baseline threshold tuning — re-derive every
[tune-after-baseline]latency/leak number from the smoke’s idle floor (proposal: latency SLO =idle-floor × 3; leak tolerance =idle ±15%), then flip the manifest’sslo_thresholds_versionfromv1-proposed→v2-measured.- Phase-0 unknowns confirmed (§9 Phase 0):
renew-timer:900,max_connections,dns_recordhard-delete, DHCP topology, rendered configs.
2. Test target & topology
2.1 The single-node clean appliance (system under test)
A k3s all-in-one (Debian/mkosi, embedded etcd, Flannel host-gw, pods 10.42/16,
svc 10.43/16) running two Helm releases in namespace spatium. On a single
node everything collapses to 1 replica:
| Component | Sizing | Source |
|---|---|---|
| api | 1 (HPA off, APPLIANCE_MODE), uvicorn --workers 1, pool 30/process |
Dockerfile:137, config.py:21-22, db.py:28-50 |
| worker | 1, concurrency 4, queues ipam,dns,dhcp,default, lim 2000m/1Gi |
values.yaml:258-259 |
| beat | 1 | — |
| frontend | 1, hostNetwork :80/:443 (no MetalLB/NodePort/Ingress single-node) | dns-bind9.yaml/topology recon |
| CNPG postgres | instances=1, req 100m/256Mi lim 1000m/1Gi, max_connections=200, shared_buffers=256MB, work_mem=16MB, stock PG16 autovacuum (no overrides) |
values.yaml:399-402, cnpg-cluster.yaml:81-83 |
| Redis | sentinel kind, 1 replica, maxmemory 256mb |
topology recon |
| bind9 (or powerdns) | hostNetwork DaemonSet, real udp/tcp :53 on node IP, no resource caps | dns-bind9.yaml:50-57,103-109 |
| kea | hostNetwork DaemonSet, udp/67 on node NIC, cap_net_raw, no resource caps |
dhcp-kea.yaml:41-66, render_kea.py:611-618 |
| supervisor | hostNetwork DaemonSet (bounded, one supervisor — not a device-scale path) | — |
bind9 listens on REAL :53 (not 1053/5353 — those are docker/dev). BIND statistics-channels is bound
127.0.0.1:8053in-container (agent-only, not externally reachable). Kea control socket is127.0.0.1in-pod.
What single-node means for the DB-bottleneck question (criterion a):
- No read replica. Every dashboard/list/conformity full-table scan
(
IPAddress JOIN Subnetover ~300k rows) competes for the same backend absorbing the write firehose. The only relief valves are indexing,work_mem, and the connection pool. - One Postgres owns all 200 connections. Generous on paper (~50/200 used at default replica counts), but a single backend means a few long-held connections (the 5-min sweep, a daily prune, a wake-storm DNS rebuild) translate directly into request-pool back-pressure and latency.
- bind9/kea/api/worker/CNPG/redis all share the node’s CPU. bind9 + kea run hostNetwork with no resource limits, so a query/DORA surge can CPU-starve Postgres and masquerade as a DB bottleneck. Node CPU must be attributed separately (§6 Layer 5) or criterion (c) is misdiagnosed.
- shared_buffers=256MB / work_mem=16MB are small for repeated 300k-row scans and conformity joins → expect on-disk sorts/spills on big SELECTs (IO wait, not lock wait).
Multi-node contrast (out of scope, noted for the report). On HA the DB story differs in exactly two ways: read offload to the CNPG replica, and the
dns_record_opfan-out multiplies by DNS-server count (one op row per enabled agent-based server in the group,record_ops.py:210-219). Single-node = one bind9 server = one op row per record.
2.2 How load reaches the data plane
All load lands on the single node IP (no MetalLB/NodePort/Ingress on single-node):
- DHCP →
udp/67on the node NIC. Topology decision (Phase 0):- relay/giaddr (campus realism): set the DHCP group
dhcp_socket_mode=relayso Kea rendersdhcp-socket-type: udp; Kea selects a subnet by matching the packet’sgiaddragainst that subnet’srelay.ip-addresses. One giaddr selects exactly ONE subnet — so multi-subnet relay needs 8 distinct giaddrs, each matched to one subnet’srelay_addresses, and the seeder must populaterelay_addresses=[giaddr_i]per scope (§3.1.2, critique C3). perfdhcp runs one shard per giaddr template; the orchestrator shards devices by subnet→giaddr. - direct L2 broadcast (simpler v1 fallback): single VLAN/scope,
dhcp_socket_mode=direct→raw(AF_PACKET). Load-gen box on the same broadcast domain. One subnet only.
- relay/giaddr (campus realism): set the DHCP group
- DNS → plain unicast
udp/tcp :53on the node IP (dnsperf -s <node-ip> -p 53). No L2 broadcast needed — the load-gen box can be anywhere routable. - Control-plane API →
https://<node-ip>/api/...through the hostNetwork frontend nginx → api (verify=False/ pinned self-signed cert; §7.6.6).
2.3 Where the generators run (off-box, pinned allocation)
Load generators NEVER run on the appliance. Co-locating would steal the exact CPU/memory/IO/connection budget being measured, and bind9/kea are already uncapped. Pinned allocation (critique G3 — prevents the Python event loop starving the C generators and NIC/CPU contention):
| Box | Runs | Why isolated |
|---|---|---|
| lg-0 (controller) | spddi-perf controller + war-room poller + (off-box Prometheus/Grafana, §6) |
Low CPU; owns run_id/state/manifest/artifacts. Conductor + watchdog + checkpointer only — no protocol I/O. |
| lg-1 (protocol floors) | perfdhcp shards (≥2–4 procs, sharded by MAC range) + dnsperf/resperf/flamethrower | The C blasters; isolated NIC/CPU from the orchestrator. |
| lg-2 (orchestrator) | the custom diurnal orchestrator (the DB-pressure driver) — sharded across N procs | Kept on its own box so perfdhcp’s raw blast can’t starve the lifecycle engine we care about. |
Box/shard counts are pinned by the smoke run’s capacity calibration (§1.9).
Each box NTP-synced to the in-lab source (§4.9, §7.5.1). ≥2 boxes is the
floor; the morning-surge peak offered rate may require a third for the
orchestrator.
2.4 Existing observability surfaces (war-room foundation)
The appliance ships no Prometheus, no Grafana, no metrics-server, no
postgres/redis exporter (kube-state-metrics + node-exporter are in the chart
but enabled: false with nothing to scrape them). The native surfaces that
already back the product dashboards:
GET /health/platform(unauth) — api/postgres/redis/celery-workers/celery-beat dots + flags. Best always-on heartbeat.GET /api/v1/admin/postgres/{overview,connections,tables,slow-queries,schema-health}(superadmin) — conns/max, cache-hit, WAL, longest-txn, by-state breakdown, dead_tup + last_autovacuum, pg_stat_statements top.pg_locks/deadlocks are NOT exposed — psql only.GET /api/v1/admin/redis/{overview,wake-bus,keyspace}— mem/ops/evicted_keys, pub/sub channels + subscriber count.GET /api/v1/metrics/{dns,dhcp}/timeseries?window=…— 60s agent counter buckets (fine for trend, too coarse for the per-second ceiling).- Celery queue depth: no native endpoint — read Redis
LLEN ipam|dns|dhcp|default.
§6 builds the war-room on these plus a deliberately-added, off-box-isolated Prometheus/Grafana stack with tightly-capped on-node exporters.
3. DHCP load generator
Two-tool hybrid. perfdhcp = a short raw-protocol ceiling probe proving Kea isn’t the limiter. Custom asyncio orchestrator = the realistic 24h lifecycle that drives the agent→control-plane→IPAM→DDNS→DB write firehose.
3.0 Why two tools
| Tool | Measures | Cannot do | Feeds |
|---|---|---|---|
perfdhcp (Debian kea pkg, on load-gen box — NOT in the appliance Alpine image) |
Raw Kea v4 ceiling: max DORA/s + renew/s, ACK p50/p95/p99 at the wire | No 24h staggering; no per-device lifecycle; no IPAM/DDNS shaping; no operator-API stream | (c) protocol-tier ceiling; (b) raw DHCP-ACK latency |
| Custom asyncio orchestrator (greenfield) | Realistic 24h lifecycle (staggered arrivals, DORA, T1/T2 renewals, releases, 250–300k unique identities on the §1 curve); drives the DB write firehose | Won’t out-pace perfdhcp on pure protocol QPS — fine, not its job | (a) DB write-amp/contention/autovacuum; (b) propagation lag; (c) the real ceiling (control-plane/DB); (d) soak |
Run perfdhcp first (short probe) so we know the protocol ceiling before the 24h soak and can attribute any orchestrator-tier ceiling to the control plane, not Kea.
3.1 perfdhcp — raw Kea v4 ceiling probe
Placement. perfdhcp is not in the appliance Kea image (Alpine apk) — the
Debian kea package ships /usr/sbin/perfdhcp. Install on lg-1 (8+ vCPU).
Invocation (full DORA ceiling):
perfdhcp -4 \
-r <rate> \ # offered DORA rate; ramp 2-5k/s upward until p99 degrades
-R <num-clients> \ # distinct simulated clients (unique MAC/client-id)
-p <period-s> \ # bounded probe, e.g. 120
-t <report-int-s> \ # periodic stats line for the latency histogram (e.g. 1)
-T <template> \ # (relay) packet template carrying giaddr for subnet select
<node-ip> # unicast target (relay); omit for broadcast (direct)
-ris the ceiling knob: step up until ACK p99 degrades or Kea drops (decline/timeout). Renew-only ceiling: a two-phase run grabs N leases then re-requests them (RENEWING state) — proves the Kea-side renewal ACK rate and how fast the agent CSV-tail + lease-events ingestion falls behind (watchlease_events_buffer_trimmed).- Client cardinality (critique C4, §1.9 gate): perfdhcp
-Rkeeps per-client state in memory and degrades with cardinality; 250–300k clients on one process is past stable. Shard by MAC range across processes/boxes (e.g. 6 procs × 50k clients on disjoint OUI ranges) and sum rates. The smoke run measures the max stable clients/proc and derives shard count — a hard go/no-go gate before the 24h run. For the ceiling probe a representative-R(e.g. 50k) at high-rsuffices; the 300k cardinality matters more for the orchestrator’s IPAM-row-growth test.
perfdhcp’s hard limits (why it’s not enough): no diurnal curve, no per-device lifecycle, no IPAM/DDNS shaping, no operator-API stream. It answers “is Kea the bottleneck?” (almost certainly no) and gives the raw ACK baseline. Everything realistic is the orchestrator.
3.1.2 Relay/giaddr topology — fully specified (critique C3)
If relay is chosen as the headline topology:
- Seeder sets
relay_addresses=[giaddr_i]on each scopei(one giaddr per subnet). The manifest carries an 8-entrygiaddrlist, not a singular value. - DHCP group
dhcp_socket_mode=relay→ Kea rendersdhcp-socket-type: udp, answers unicast back to the relay IP. - perfdhcp runs one shard per giaddr template (
-Twith the per-subnet giaddr stamped); the orchestrator’s raw-packet builder stamps the correct per-subnet giaddr per device shard.
If relay proves too fiddly for v1: fall back to direct L2 broadcast on a
single VLAN/scope (dhcp_socket_mode=direct → raw) and accept that
multi-subnet scope-selection is out of v1 scope. This is a Phase-0 decision —
it changes the seeder, the perfdhcp shard count, and the Kea socket mode.
3.2 Custom asyncio orchestrator
Goal. A single greenfield Python program (on lg-2, off-box) modeling 250–300k devices as independent state machines, driven by the §1 diurnal curve, generating real DHCPv4 packets to Kea so the full agent→control-plane→IPAM→DDNS→DB path is exercised as production would.
Per-device FSM:
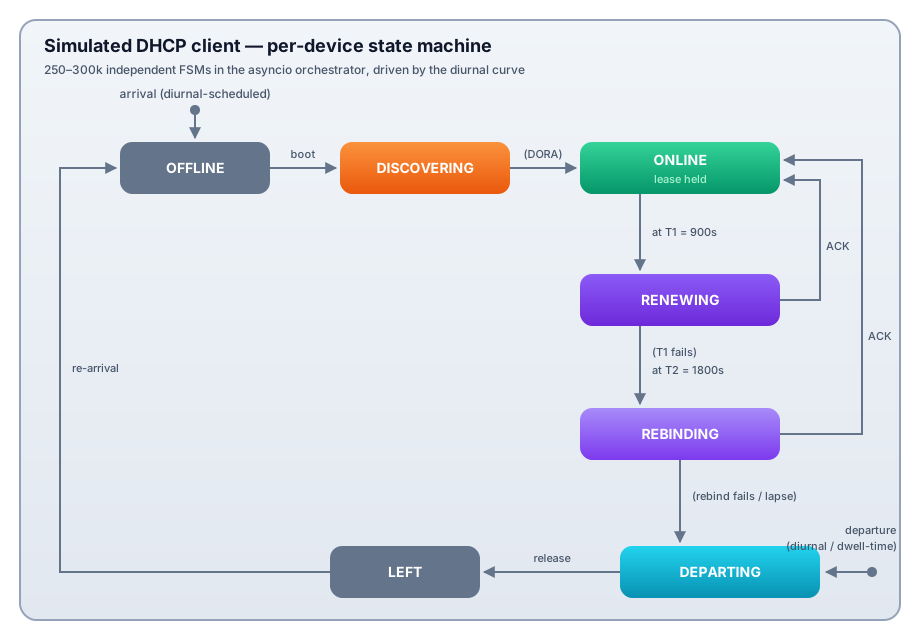
- DORA on arrival → first
dhcp_leaseINSERT +ip_addressmirror INSERT + DDNS publish (A+PTR). Record(IP, lease_time, T1=900, T2=1800). - RENEWING at T1=900s (the dominant steady-state event, §0.A): unicast
REQUEST re-requesting the CURRENT lease (same ciaddr/IP) — not a fresh
DISCOVER. Each renewal = one Kea CSV row = one
dhcp_leaseUPDATE; the IPAM mirror UPDATE is elided (stable hostname/MAC) and DDNS short-circuits (idempotent). This is a hard FSM contract (critique H3): a renewal that lands on a different IP would get a new IP-derived name → full 6-DNS-write cascade → ceiling collapse. The report makes a low short-circuit ratio a named correctness FAIL (§8.2.4). - REBINDING at T2=1800s (only if T1 unanswered) — broadcast REQUEST; modeled so a Kea/agent stall produces realistic rebind traffic instead of silent loss.
- DEPARTING → LEFT — ~5% explicit DHCPRELEASE (drives immediate expiry →
dhcp_lease_historyINSERT + IPAM DELETE + DDNS-revoke), 95% silent (reaped bysweep_expired_leasesevery 300s — the full-Subnet-scan-per-lease hot path, §5 H8). - Re-arrival — a device that LEFT can re-arrive later (commuter returns) as a fresh DORA; same stable client-id makes it an update, not new-lease churn.
Identity generation. MACs from a locally-administered OUI (02:00:00:xx:xx:xx,
24-bit index → 16M+ unique, partitioned across shards so they never collide).
client-id (option 61) derived deterministically from the MAC so re-arrivals
present a stable identity. hostname (option 12) assigned to a configurable
fraction (~60–80%) of devices → DDNS publishes A+PTR; devices without a hostname
skip DDNS (the bare-lease path). This fraction is the lever that drives
dns_record/dns_record_op/dns_zone.last_serial write pressure separately from
the bare lease firehose.
Packet library. raw socket + pre-built byte templates (struct) for the
hot send loop — pre-encode each device’s DISCOVER/REQUEST once, mutate only
xid/secs/(renew)ciaddr/giaddr per send. scapy only for a validation harness
(decode the first exchanges, confirm option layout, then trust the byte-packer).
The receive path parses just enough of OFFER/ACK (yiaddr, server-id, option 51,
T1/T2) to drive the FSM and timestamp latency.
Concurrency & scaling. asyncio event loop per worker process; devices are coroutines on a timer-wheel scheduler (next DORA / next T1 / next departure fires at due time — this is how the diurnal curve becomes real traffic; renewals self-schedule at 900s after each ACK so renewal load automatically tracks concurrent-online). One loop is CPU-bound at high pps → shard the population across K processes (K ≈ vCPU), each owning a disjoint MAC index range + its own loop + raw socket. Multi-box if one box can’t sustain the surge peak. Instrument scheduler lag (fire-time − due-time) as a load-gen-health metric so load-gen saturation is never mistaken for an appliance bottleneck.
3.3 Address space / pool sizing
No prefix-length floor, no v4 pool size cap; one pool spans a /16
(render_kea.py:299). Subnet create is cheap (~3 placeholder rows, NOT one per
host, ipam/router.py:3552-3681) — the 250–300k ip_address rows are created
lazily as auto_from_lease=True mirrors when lease-events arrive. Do not
pre-seed addresses.
Sizing against max(peak_concurrent, D_total) for the lease in play (critique
M1):
- 8 × /16 under
10.0.0.0/8= 524,272 usable; ~90% dynamic pools ≈ 472k capacity. - 2h-lease profile: allocated ≈ peak concurrent (150k) → ~32% fill, trivially fine.
- 24h-lease profile: departed-but-not-reaped devices hold IPs for up to
lease_time, so over 24h of arrivals allocated approaches
D_total(~300k) before any expiry → 300k/472k ≈ 64% fill — still OK, but the binding number isD_total, not the 150k concurrent figure.
Reverse zones per §0.A (8 per-octet headline; single-zone H3 variant).
3.4 Exercising the full lease → control-plane → IPAM → DDNS path
- Lease firehose → DB write-amp (a). Every DORA + every T1 renewal → Kea CSV
row → agent batches →
lease-eventsPOST →dhcp_leaseupsert +ip_addressmirror upsert. Watchdhcp_lease/ip_addressn_dead_tup + last_autovacuum, pool checkout-wait,lease_events_buffer_trimmed. - DDNS write-amplifier (a). The hostname-bearing fraction drives first-lease
A+PTR INSERTs +
dns_record_opfan-out + per-opdns_zone.last_serialUPDATE on the shared hot row. Renewals short-circuit, so DDNS pressure tracks new arrivals, not renewals — instrument it separately. - Propagation lag (b). On a 1-in-1000 rotating subset of arriving devices,
poll until the
auto_from_leaseIPAM row appears (lease→IPAM lag, floor ≈ the agent batch window — which is 5s at the trough but ~0.6–1.9s at peak because the agent flushes on the 100-event count trigger; the propagation SLO is therefore phase-aware, critique b-iii), thendigBIND for the A/PTR (IPAM→DNS lag, adds the/configwake + nsupdate). Budget ~5–12s. Report p50/p95/p99 of both legs. Single-clock (the orchestrator owns both timestamps) so it is robust to cross-box skew — but the war-room correlation against 60s metric buckets still needs NTP (§4.9). - Operator-API contention stream (a). Folded into the headline at 2–5/s (§1.6) — separate auth context + rate knob so contention is attributable.
3.5 Metrics the DHCP generator emits
Per-protocol (both): DHCP-ACK latency p50/p95/p99/max (DORA and renewal, separately); exchange outcomes (ACK/NAK/DECLINE/TIMEOUT/retransmits — DECLINE+TIMEOUT are the protocol-tier health signal for (c)); offered vs achieved rate (divergence = load-gen saturation, not appliance).
Orchestrator-specific: concurrent-online over time (traces the diurnal curve); renew/s (= online/900); DORA rate; both propagation-lag legs; per-shard scheduler lag (load-gen health); departure/release/lapse/re-arrival counts; unique-MAC accounting (must reach 250–300k); the DDNS wrote-vs-short-circuited ratio (must be ~0% on renewals — H3).
Output: streaming time-series (CSV/JSON-lines, 10s cadence) + a final summary JSON + HdrHistograms (DORA + renew, full-run + per-phase). NTP-synced timestamps so they align with appliance 60s metric buckets.
3.6 DHCP-specific watch items
- Kea memfile LFC every 3600s on a 300k-lease CSV — confirm the hourly
compaction pause doesn’t stall ACKs (would show as periodic p99 blips).
Instrument LFC-pause timing as a labeled event and decide whether to tune
lfc-intervalfor the run (critique G4). - Agent drain chunking on post-stall recovery (critique M4): the server
accepts max 500 leases/POST (
agents.py:151,extra=forbid→ 422 rejects the whole batch). The agent normally flushes at 100, but verify in the dry run that it chunks its drain to ≤100 (or ≤500) when recovering from a backlog — if it POSTs the full 5000 buffer, a recovery 422s and loses the batch (IPAM under-count). Add a war-room watch for 422s on/lease-eventsspecifically. dhcp_leaseorphan accumulation (critique L4/d-i): no unique constraint on(server_id, ip_address)(models/dhcp.py:633-638) — a MAC change on the same IP creates a second row, never reaped by the time-sweep. At dorm-scale device swaps this is real soak growth. Measured in the §8.2.4 ledger (dhcp_leaserows vs distinct active IPs).
4. DNS load generator
The DNS half of the hybrid. Core thesis: the raw DNS protocol layer (BIND answering authoritative queries from memory) does NOT touch the control-plane DB, so the DNS QPS ceiling and the DNS DB-write ceiling are two separate numbers measured independently.
4.0 Three load shapes
| Shape | Tool | Answers | Criterion |
|---|---|---|---|
| Raw-QPS ceiling | dnsperf -Q, resperf, flamethrower |
Max authoritative QPS BIND sustains; which component gives first | (c), (b) at load |
| Per-device diurnal streams | orchestrator (dnspython, shared) | Realistic 24h DNS correlated with the lease fleet; soak | (d), (b) propagation, partial (c) |
| DDNS write pressure | DHCP gen → control plane → nsupdate | dns_record/dns_record_op/dns_zone-serial write health; lease→DNS lag |
(a), (b), (d) |
4.1 How DNS load reaches the appliance + recursion OFF
- bind9 on real :53 UDP+TCP, hostNetwork →
dnsperf -s <node-ip> -p 53. No L2 broadcast, no NodePort. PowerDNS (alt driver) also hostNetwork :53 (verify the rendered port). - Recursion OFF for the test.
DNSServerOptions.recursion_enableddefaults True (bind9.py:251), and per-view default is also True (bind9.py:421). Setrecursion_enabled=False(and any view’srecursion=False) so the renderednamed.confcarriesrecursion no;, no forwarders, notype forwardzones. This is both a safety requirement (§4.9) and the correct measurement choice — external recursion would inject wide uncontrollable latency variance and make the p99 numbers meaningless.
4.2 The query set (the heart of the DNS generator)
Ground-truth names that exist in our zones:
- DDNS forward names —
_generate_hostname(ip_str)(ddns.py:162): for IPv4,dhcp-<3rd>-<4th>(e.g.10.1.20.5→dhcp-20-5) underalways_generate, or the sanitised client hostname underclient_or_generated. Either way anA(andAAAAfor v6) in the subnet’s forward zone, with a matchingPTRin the reverse zone (router.py:1308-1344). - PTR names — in the reverse zone(s) for the lease ranges (
dig -xform). - Static/scaffold names — apex SOA/NS + seeded infra (
_ldap._tcp,mail,www,vpn, SPF/DKIM TXT).
The correlation mechanism: the query generator synthesises FQDNs from the same device-fleet manifest the DHCP generator uses (§4.5) — names are computable without scraping the live zone, so “a device that got a lease then gets queried by name” works by construction.
Composition per §1.7 (record-type mix + Zipfian s≈1.0). The generator emits
a queries.txt (<qname> <qtype> per line, e.g. 5–20M lines), built from the
device manifest + the seeded-zone manifest, weighted by Zipf and shuffled. Keep a
“steady-state” file and a “cold/NXDOMAIN-heavy” file for the negative-path
sub-run.
Query-set validation (critique H4, §4.9 Layer 2): every generated qname must be a suffix-match of a seeded zone (a CI/unit check rejects out-of-zone names). Deliberate misses are random labels under a seeded zone (→ authoritative NXDOMAIN), never random apex names (→ REFUSED, a leak/bug).
4.3 Raw-QPS ceiling generators
- resperf (ships with dnsperf, preferred ceiling tool) — ramps the send
rate linearly and finds where the server stops keeping up, emitting a CSV of
(time, sent, answered, latency, loss). The QPS at whichanswered < sentis the protocol ceiling. Run it first to bracket, then dnsperf at ~80% of the ceiling for the sustained plateau/soak (run below the cliff for stability work).resperf -s <node-ip> -p 53 -d steady_queries.txt -m 200000 -r 180 -c <clients> -P resperf.csv - dnsperf
-Q— fixed sustained QPS + full latency percentiles + RCODE breakdown; staircase5k→10k→25k→50k→100k→150k, each-l 600. First step whereachieved < 0.98×targetOR p99 > SLO OR SERVFAIL/timeout > 0.1% is the authoritative ceiling. Add a TCP sub-run (force TCP) — BIND’s TCP path is a separate, lower ceiling. - flamethrower — cross-check + the cache-buster sub-run
(
numbername/randomlabelunique-qname flood under a seeded zone) which stresses the NXDOMAIN/negative path harder than the Zipfian set. Bounded, not the main plateau.
Validate the client isn’t the bottleneck: point dnsperf at a throwaway local BIND first and confirm it generates » the appliance number. Shard the query file across 2+ boxes if one tops out, coordinating with the DHCP load-gen box so they don’t contend on one NIC (§2.3).
4.4 query_log_enabled — the confounding firehose
OFF for ceiling/throughput (BIND answers from memory; on, every query is a
dns_query_log_entry INSERT — at 100k qps ≈ 8.6M rows/hour, the single largest
INSERT/table-size/autovacuum/bloat driver). ON only in a dedicated bounded
firehose sub-run measuring: dns_query_log_entry INSERT throughput + POST
latency; dns_query_log_buffer_trimmed rate; the daily-prune bulk DELETE
duration + dead-tuple burst + whether autovacuum reclaims before the next day;
table/index bloat trajectory.
4.5 DNS↔DHCP correlation (shared device-fleet manifest)
- The orchestrator owns a device-fleet manifest —
{mac, client_hostname,
assigned_subnet, expected_ip_or_pool, arrival_window}
for every modeled device. - The DHCP generator drives DORA/renew from it; each leased device’s IP mirrors
to IPAM and (DDNS subnets) publishes A(+AAAA)+PTR. Forward name is
deterministic (
client_hostnameordhcp-<3rd>-<4th>). - The DNS query set/streams are generated from the SAME manifest.
This yields the realistic ordering: device arrives → lease → DDNS publishes name → shortly after, other devices/services query that name. The orchestrator enforces a small lag between a device’s lease and the first query for its name (doubling as the propagation-lag probe, §4.6.3). Forward-coupling realism (critique E1): model a post-lease forward-query burst — a device that just joined immediately resolves the campus auth/portal/update names — not just the PTR-on-leased-ranges direction.
Names for not-yet-leased / expired devices land in the NXDOMAIN slice (free negative-path load) — but bound its volume so the authoritative-hit ratio stays ≥95% (critique E2).
4.6 DDNS write pressure (DNS-side DB stress + propagation lag)
The write path (verified, §5.2). A first-time DDNS publish for one device on
single-node (one bind9 server in the group) emits: 2× INSERT dns_record (A+PTR),
2× INSERT dns_record_op (one op per enabled agent-based server — 1 on
single-node), 2× UPDATE dns_zone.last_serial (one SOA bump per record op —
the forward zone row is shared by every device in the subnet tree → hot-row UPDATE
contention), a Redis collect_wake(dns_group_channel) after commit, and 0
audit rows. Renewals are cheap (idempotency short-circuit ddns.py:271 —
hostname unchanged + dns_record_id set → zero DNS writes), so the DDNS write
firehose is driven by new-device arrivals, not renewals — the morning arrival
surge is the DDNS write peak. Expiry/sweep produces the mirror DELETE cascade.
How the DNS generator stresses it (passive, driven by DHCP): seed forward +
matching reverse zones so DDNS has somewhere to write (ensure_reverse_zone_for_subnet,
router.py:1098); set test subnets to always_generate; drive the arrival rate
past steady-state to find where dns_zone serial-UPDATE contention,
dns_record INSERT rate, or the record-op pipeline knees.
Propagation-lag measurement (b), §4.6.3: for a sampled subset of arrivals,
record t_lease (ACK moment), dig +short @<node-ip> <hostname>.<zone> A every
250ms, t_resolve = first correct answer → lag = t_resolve − t_lease (p50/p95/p99).
Cross-check the server-side half via DNSZone.last_serial (intent) vs
DNSServerZoneState.serial (what bind reports serving, POST /dns/agents/zone-state,
dns/agents.py:524) — a growing gap = the agent falling behind on applying ops, a
propagation-lag early warning distinct from the per-name probe.
PowerDNS difference: applies record changes via its HTTP API (not RFC2136 nsupdate), but the control-plane path up to the agent is identical; the propagation probe is unchanged. Online-DNSSEC signing adds per-change CPU — note it as a separate variable; prefer DNSSEC-off for the baseline write-ceiling number. Headline driver = bind9; PowerDNS/DNSSEC explicitly deferred (critique G8).
4.6.5 Wake-storm caveat (a likely first-to-give control-plane ceiling)
Each DDNS-touching lease-events batch publishes one dns_group Redis wake, and
the DNS /config long-poll rebuilds the WHOLE DNS group bundle on every wake
— including an N+1 SELECT DNSRecord WHERE zone_id per zone
(agent_config.py:176-177). At 250–300k DDNS records this materializes the entire
record set into Python on each rebuild, holding a CNPG pool connection for the
rebuild duration. Under a heavy morning surge, batches publish wakes faster than
the 12s WAKE_TICK_SECONDS floor → back-to-back heavy rebuilds. Instrument,
during the DDNS write peak: the DNS /config rebuild rate vs arrival rate; the
per-zone DNSRecord query latency in pg_stat_statements; CNPG pool-checkout
wait. This is a control-plane/DB ceiling distinct from the BIND QPS ceiling —
attribute it separately (recon configbundle-poll.md bottleneck #1).
4.7 Per-device streams vs standalone dnsperf
- Standalone dnsperf/resperf/flamethrower for ceiling discovery (max QPS, ramp-to-failure), negative-path/cache-buster stress, and TCP-path ceiling — run as bounded sub-runs layered on top of the ever-present orchestrator baseline (so ceiling runs measure “headroom above realistic load”, the honest number).
- Orchestrator per-device streams (dnspython
dns.asyncquery, same async loop- manifest as the DHCP lifecycle) for the 24h diurnal curve (each online device emits a Poisson stream from the Zipfian set, ramping with the arrival curve), correlated lookups (only the orchestrator knows which devices are leased), and propagation-lag probing. The orchestrator does NOT try to be a QPS ceiling tool — for raw throughput it coordinates with dnsperf.
4.8 Metrics the DNS generator emits
Client-side (per-second; ceiling + SLO truth): achieved QPS vs target; latency p50/p95/p99/p999/max; RCODE breakdown NOERROR/NXDOMAIN/SERVFAIL/REFUSED (REFUSED is a distinct, should-be-zero counter — non-zero = out-of-zone query-set bug / leak attempt, §4.9); timeout/dropped rate; TCP-vs-UDP split; per-name-class breakdown (forward-A / PTR / SRV / DDNS-tail / NXDOMAIN-miss — tells us which record class is the slow path).
Server-side (60s; trend + DB health): /metrics/dns/timeseries
(queries_total/noerror/nxdomain/servfail/recursion/rate_dropped/rate_slipped —
cross-check vs client achieved-QPS; a gap means queries dropped before BIND counts
them, i.e. NIC/conntrack/kernel); dns_record / dns_record_op row counts (the
latter never pruned — watch unbounded growth); dns_zone n_dead_tup +
last_autovacuum + lock-wait; propagation lag + zone-state gap; wake-storm health.
SLO targets (finalize in §8.3): DNS resolve p99 (proposed <10ms UDP authoritative on-LAN); lease→DNS propagation p95 <~10s; SERVFAIL <0.1%; REFUSED = 0; timeout ~0.
4.9 DNS safety — authoritative-only, zero internet egress (HARD CONSTRAINT)
This is a safety requirement, not a tuning knob. With recursion left at its default (ON,
bind9.py:251), any out-of-zone query would be resolved recursively to the public internet — at university query volume a load test emitting out-of-zone names would flood public DNS infrastructure (rate-limiting, abuse complaints, contaminated latency numbers). The DNS test must be closed-loop.
Five independent layers (all required — a single mistake must not leak):
- Pre-populate BIND with a large authoritative dataset (also a scale stressor): forward zones with hundreds of thousands of A/AAAA keyed to the device fleet; reverse zones covering the entire leased space; DDNS-created names (in-zone by construction). Sizes the seed (the seeder must bulk-load via the record-op pipeline; flag if bulk seeding itself needs a fast path).
- Authoritative-only query set — only suffix-matches of seeded zones; a bounded in-zone NXDOMAIN slice; zero apex/external names. The query-set builder validates every qname is in-zone and aborts otherwise.
- Disable recursion on the test BIND + every view (
recursion no;), no forwarders, notype forwardzones — so a stray query returns REFUSED locally, not an internet round-trip. - Network egress firewall — isolated test VLAN whose gateway drops all outbound DNS (UDP/TCP 53, and 853). Holds even if layers 1–3 are misconfigured.
- Pre-flight safety assertion + continuous egress watch (abort on leak):
(a) recursion probe — query a known out-of-zone name (
leak-canary.invalid), assert local REFUSED/SERVFAIL with no upstream round-trip, else abort; (b) egress watch — zero outbound :53 packets during a canary burst (tcpdump/nftables counter), abort the run on any egress; (c) in-zone coverage probe — sample N query-set names, confirm NOERROR with AA bit set. These run at t0 and the egress watch stays armed the full 24h.
Collision with NTP (critique B1): the isolated egress-blocked VLAN may have no internet NTP reachability, but criterion (b)’s propagation lag and the war-room correlation need synced clocks. Stand up an in-lab NTP server inside the isolated VLAN (point the appliance chrony + all load-gen boxes at it) and add a clock-skew pre-flight gate (offset < 50ms on all boxes). Hard prerequisite.
5. Control-plane & DB bottleneck analysis + ready mitigations
The heart of criterion (a). The protocol tier (Kea ACK / BIND resolve) is not the ceiling — all Postgres pressure is indirect, generated by the agents tailing daemon state and POSTing it back. The ceiling we hunt is an ingestion + DB ceiling on a single CNPG instance.
5.1 Verified facts the analysis rests on
- Audit advisory lock key
0x4144495441554449, transaction-scoped, with aseq DESC LIMIT 1read held to COMMIT (audit_chain.py:51,153,156-162), hooked viabefore_flush(db.py:174-185). Early-returns when no AuditLog rows present (audit_chain.py:99). - The device firehose writes ZERO audit rows — lease-events, DDNS, log/query/
metric shipping never call
write_audit(agents.py:1097-1105documents the omission). Audit cost gates operator/API + integration reconcilers only. dns_record_oprows are NEVER deleted — flipped tostate="applied"and left (record_ops.py:82,354;ack_oprecord_ops.py:362-385). No prune task referencesDNSRecordOpanywhere (grep ofbackend/app/tasks/+celery_app.pyclean). Unbounded soak-growth table.dns_record“delete” is a HARD heap DELETE —_sync_dns_recorddelete path usesawait db.delete(record)despiteDNSRecordcarryingSoftDeleteMixin(the revoke path bypasses the mixin). So the dead-tuple/bloat math treats revoke as a DELETE — verified correct (critique H6 closes Section 4 §4.7 #1).metric_sampleis an idempotent upsert keyed(server_id, bucket_at)(agents.py:998-1004) → ~2 rows/min total, overwritten in place. Negligible — bounded by servers, not devices.dhcp_lease_historyretention 90d (dhcp_lease_history_prune.py:35-41) → in a 24h test it only grows (fastest-growing table).prune_log_entriesis a single unchunkedDELETE … WHERE ts < cutofffor both log tables in one transaction, once per 24h (prune_logs.py:42-45,celery_app.py:259-261).- App pool
pool_size=10 + max_overflow=20 = 30/process(config.py:21-22,db.py:28-50); Celerytask_session()= fresh enginepool_size=1per task, disposed infinally(db.py:82-102). - CNPG
max_connections=200,shared_buffers=256MB,work_mem=16MB, no autovacuum overrides (values.yaml:399-402). Single-node = 1 instance, 200 conns on one backend, no read replica. (Verified 200, not 100 — thetestinfra-seedingrecon doc said “default 100” and was wrong; confirm on the booted test appliance as a Phase-0 gate, critique a-i.) pg_stat_statementsOFF by default — must be enabled before the run (CNPGparameters+ restart +CREATE EXTENSION;admin/postgres.py:327-343).sweep_expired_leasesevery 300s: SELECTs expired active leases (no(state, expires_at)composite index,models/dhcp.py:634-638→ poor selectivity), then for each lease with nullscope_iddoes a fullSubnettable scan + Python longest-prefix match PER LEASE (dhcp_lease_cleanup.py:35-64), all in one long write transaction.
5.2 Write-amplification map — one device’s full day → rows written
A DDNS-enabled subnet with one agent-based bind9 server (single-node). Each cell is heap-tuple-producing write statements per the cited code path.
| Event | dhcp_lease |
ip_address |
dns_record |
dns_record_op |
dns_zone serial |
dhcp_lease_history |
dhcp_log_entry |
dns_query_log_entry |
metric_sample |
event_outbox |
audit_log |
|---|---|---|---|---|---|---|---|---|---|---|---|
| DORA (first attach) | 1 ins | 1 ins | 2 ins | 2 ins | 2 upd | 0 | ~4 | 0 | 0¹ | 0² | 0 |
| Renew T1 | 1 upd | 0³ | 0⁴ | 0 | 0 | 0 | ~2 | 0 | 0¹ | 0² | 0 |
| Renew T2 | 1 upd | 0³ | 0⁴ | 0 | 0 | 0 | ~2 | 0 | 0¹ | 0² | 0 |
| Each logged DNS query | 0 | 0 | 0 | 0 | 0 | 0 | 0 | 1 ins | 0¹ | 0² | 0 |
| Lease expiry/sweep | 1 upd | 1 del | 2 del | 2 ins | 2 upd | 1 ins | 0 | 0 | 0¹ | 0² | 0 |
Footnotes: ¹ metric_sample idempotent upsert keyed (server_id, bucket_at)
— ~2 rows/min, negligible. ² event_outbox only writes when enabled
EventSubscription rows exist — zero on a clean appliance. ³ IPAM mirror UPDATE
on renewal is elided when hostname/MAC unchanged (agents.py:866-871
re-assigns unconditionally, but SQLAlchemy dirty-tracking elides the UPDATE when
values are identical — last_seen_at lives on dhcp_lease, not the mirror).
⁴ DDNS idempotency short-circuit (ddns.py:271-272) → zero DNS writes. This is
load-bearing for the whole throughput story — instrument the wrote-vs-short-circuited
ratio; a broken short-circuit turns every renewal into 6 DNS writes and collapses
the ceiling.
Per-device-day total (one DORA + R renewals + DDNS + one expiry, R = 24h / 900s ≈ 96 renewals for a device online all day — note R is set by the 900s cadence, not lease/2):
dhcp_lease        : 1 (ins) + R (upd) + 1 (upd)   = R + 2     (~98 for a resident)
ip_address        : 1 (ins) + 0 + 1 (del)         = 2
dns_record        : 2 (ins) + 0 + 2 (del)         = 4
dns_record_op     : 2 (ins) + 0 + 2 (ins)         = 4   ← never deleted (soak growth)
dns_zone serial   : 2 (upd) + 0 + 2 (upd)         = 4   ← all on the SHARED hot zone row
dhcp_lease_history: 0 + 0 + 1 (ins)               = 1   ← never pruned in 24h
dhcp_log_entry    : ~4 + 2R + 0                    ≈ 2R + 4
audit_log         : 0                              = 0
Excluding the query firehose: ≈ (2R + 19) write statements per device-day.
The DNS query firehose is separate and dominates row volume:
dns_query_log_entry ≈ q/device/hr × active hrs ≈ 100 × 16 = ~1,600 inserts/device-day
(qlog on) — two orders of magnitude over the control-plane writes.
Aggregate peak rates the DB must survive (multiplying by §0.A peak rates):
| Table | Peak write rate | Notes |
|---|---|---|
dns_query_log_entry |
~10,000+ ins/s (qlog on) | #1 row-count/autovacuum/bloat driver; ~360M rows/day at 10k qps. OFF in the headline run. |
dhcp_log_entry |
~700–1,000 ins/s | per-Kea-log-line; second-largest insert. |
dhcp_lease |
~170–290 wr/s | high UPDATE (the 900s renewal floor) on a ~300k-row table → heavy dead-tuple production. |
dns_record |
~25–50 wr/s | A+PTR on arrivals; hard DELETE on expiry. |
dns_record_op |
~25–50 ins/s | never deleted → ~35M rows/day unbounded. Top soak-growth risk. |
dns_zone (serial) |
~25–50 upd/s | concentrated on a handful of hot zone rows → hot-row UPDATE contention. |
ip_address |
~12–25 wr/s | DORA INSERT + expiry DELETE (renewals elided). |
audit_log |
~2–5 ins/s (operator stream only) | 0 from device load — see H1. |
The number the DB must survive: at the qlog-OFF headline peak, ~230 control-plane row-mutations/sec dominated by the dhcp_lease renewal UPDATE floor + DDNS hot-row UPDATEs; with qlog ON the firehose dwarfs everything at ~10–14k heap-tuple-producing writes/s, ~80%
dns_query_log_entryinserts. Under pure device load ~0 areaudit_loginserts — the audit chain is a side-channel only the operator stream exercises.
5.3 Bottleneck hypotheses — observe + ready fix
Each: claim → observe → ready fix (tag, §5.5). Ordered by likelihood under the single-node profile.
H1 — audit_log hash-chain serialization (single-writer choke). Every audited
transaction takes the one global advisory lock held to COMMIT → concurrent audited
mutations serialize on commit duration. Effective ceiling ≈
1/mean-audited-txn-hold-time. The device firehose writes zero audit rows —
only the operator stream exercises it. Observe: pg_locks locktype='advisory'
waiter count + max wait; pg_stat_activity wait_event='advisory'; committed-
mutations/sec plateau as concurrency rises; before_flush CPU dominated by
old_value/new_value JSON size (bulk-edit diffs are the expensive case).
Fix (A): batch operator mutations under one lock acquisition; if still the
ceiling, move hash computation off the commit path (async serial hasher). Security-
critical — gate behind explicit validation that H1 fired.
H2 — connection-pool exhaustion (app pool vs max_connections). App pool =
30/process; CNPG = 200 on one backend; budget ~50/200 at default replica counts.
Bites two ways: api replicas scaling (6×30=180 → near the wall — not the
single-node case), or a burst of slow queries holding connections (the 5-min
sweep, daily prune, a wake-storm DNS rebuild that materializes the whole record
set) backing up the 30-slot request pool before Postgres’s 200 is reached →
requests queue on pool.connect(), DHCP/DNS ingest latency spikes while
pg_stat_activity active count plateaus below 200. The app pool, not
max_connections, is the real ceiling. Sticky holders: agent /config
long-polls hold a pooled connection up to 30s (agents.py:56); concurrent DNS
rebuilds during a wake-storm occupy multiple slots. Observe:
/admin/postgres/connections by-state (idle-in-transaction is the leak smell);
SQLAlchemy pool checkout-wait has no native endpoint — infer from rising
request latency + flat pg active count near 30. Fix (B): tune
database_pool_size/max_overflow (env); fix the underlying slow queries
(H3/H5); add a PgBouncer/CNPG pooler (transaction mode) to decouple app
concurrency from backend connections.
H3 — dns_zone.last_serial hot-row UPDATE + ip_address churn.
bump_zone_serial (serial.py:58) is called once per DNS record op
(router.py:872); the forward (and single-reverse-zone) row is shared by every
DDNS device → row-level lock serialization + dead-tuple churn on a tiny,
perpetually hot table. The most likely device-load-driven lock contention (no
operator stream needed) — and the predicted first-to-give in the qlog-OFF
headline run. Observe: pg_locks relation/tuple waits on dns_zone;
pg_stat_user_tables n_dead_tup/n_tup_upd on dns_zone (tiny table + huge upd
count + rising dead tuples = the signature); pg_stat_database.deadlocks. Fix
(C): coalesce serial bumps to once per agent convergence cycle instead of
once per record op (verify SOA monotonicity); aggressive per-table autovacuum on
dns_zone. The 8-per-octet reverse zone shape (§0.A) is the design that spreads
this; the single-zone variant is the deliberate worst-case probe.
H4 — log-entry insert flood vs the 24h prune. dns_query_log_entry at ~10k/s
peak (qlog on), dhcp_log_entry at ~1k/s, but the prune is a single unchunked
DELETE once per 24h. At ~360M rows/day, the daily prune is a giant DELETE →
enormous dead-tuple burst + long lock + an autovacuum storm that on a 1-CPU box
may not reclaim before the next day’s growth → compounding bloat. #1
criterion-(d) risk (qlog-on profile). Observe: both log tables’
n_live_tup/n_dead_tup/last_autovacuum at t0/6/12/18/24h; bloat before-vs-after the
prune; prune task duration + lock duration; disk free (360M wide raw Text
rows can blow the disk before the first prune). Fix (D): (1) run qlog-OFF as the
production posture; (2) raise prune cadence to hourly; (3) time-partition the log
tables → prune = DROP PARTITION (instant, no dead tuples) — best long-term
answer is ship the firehose to Loki (the module docstring says so).
H5 — autovacuum not keeping up. Stock PG16 autovacuum
(vacuum_scale_factor=0.2, 3 workers, cost-limited, no overrides) on dhcp_lease
(~300k rows, high UPDATE), ip_address, dns_zone (hot serial), dns_record_op
(grows forever), and the log tables. The 20% scale factor means autovacuum on
dhcp_lease triggers only after ~60k dead tuples — hit fast under the renewal
floor — and a cost-limited vacuum on a shared 1-CPU box may not finish before the
next threshold → progressive bloat → slower index scans → degraded propagation.
Observe: pg_stat_user_tables n_dead_tup trend (should oscillate, not ramp);
pg_stat_progress_vacuum; index-scan latency on dhcp_lease trending up. Fix
(E): per-table autovacuum tuning (scale_factor=0.02, higher cost_limit) on
the hot tables; raise global autovacuum_max_workers/vacuum_cost_limit via CNPG
parameters.
H6 — event_outbox / webhook backlog. Off by default (no subscriptions → no rows). Only a risk if the test wires webhooks. Fix (F): webhooks-OFF baseline.
H7 — metric_sample insert volume — NOT a hotspot. Idempotent upsert, ~2 rows/min. Listed to close it out with evidence.
H8 — sweep_expired_leases long write txn + full-Subnet-scan-per-lease. Every
300s, the sweep SELECTs expired leases (no (state,expires_at) index) then does a
full Subnet scan + Python longest-prefix match per lease with null
scope_id, all in one long write transaction holding locks on
dhcp_lease/ip_address and firing a DDNS-revoke cascade per lease. At
nighttime de-population this processes a large backlog every 5 min. Prime
suspect for a recurring lock/latency spike every 5 minutes. Observe: task
duration + rows processed (logged); pg_stat_activity for the sweep txn + lock
waits at each tick; the lease-events bulk-preload SELECT also does a full subnet
load per POST (pull_leases.py:350). Fix (G): add (state, expires_at)
composite index; cache the subnet list once per sweep run; batch/limit the sweep
(M leases/tick, commit, repeat).
5.4 Instrumentation plan
Pre-flight (mandatory): enable pg_stat_statements (CNPG parameters +
rolling restart + CREATE EXTENSION), pg_stat_statements_reset() at t0;
baseline snapshot of pg_stat_user_tables, table/index sizes, bloat,
pg_stat_database, disk free.
Native surfaces (always-on, no psql): /health/platform;
/admin/postgres/{overview,connections,tables,slow-queries,schema-health};
/admin/redis/{overview,wake-bus}; /metrics/{dns,dhcp}/timeseries; Celery queue
depth via redis-cli LLEN.
Direct psql (30–60s cadence, logged to CSV — the native API does NOT expose
these): pg_stat_activity (state, wait_event_type/event, xact_start, query);
pg_locks joined to activity (advisory for H1; relation/tuple on
dns_zone/ip_address/dhcp_lease for H3/H8); pg_stat_database
(commit/rollback rate, deadlocks, cache-hit, temp_files/temp_bytes for
work_mem spill); WAL rate (pg_current_wal_lsn() delta); pg_stat_user_tables
for the focus set (dhcp_lease, ip_address, dhcp_lease_history, dns_record,
dns_record_op, dns_zone, dns_query_log_entry, dhcp_log_entry, audit_log,
dns_server_zone_state); pg_stat_progress_vacuum; table+index bloat
(pgstattuple or estimate) at t0/12/24h + bracketing the daily prune;
pg_stat_statements top-by-total/mean (reset at t0).
Node-level (avoid mis-attributing CPU starvation as DB): node CPU/mem/IO;
per-pod CPU (postgres vs bind9 vs kea — a surge that pins bind9/kea can starve
Postgres and look like a DB stall); worker RSS at 02:00 for the
audit_chain_verify whole-table materialization (.scalars().all(),
audit_chain.py:191-239).
Agent leading indicators: lease_events_buffer_trimmed /
dns_query_log_buffer_trimmed / dhcp_log_buffer_trimmed — the canonical
“ingestion ceiling reached” signal (silently dropping data).
Observer self-contamination discipline (critique H1). The war-room’s own queries land on the one CNPG backend it’s measuring. Pick ONE source per pg metric — drop the JSON-exporter
/admin/postgres/*path (it goes through the api pool + CNPG) in favour of postgres_exporter + the psql poller direct. Baseline the observability query cost against the idle box and subtract/ annotate it. Back offpg_stat_statements/pg_locksscrape to 30s during steady soak; 10s only in the short ceiling windows. Tabulate the fixed observer connection overhead (postgres_exporter + redis_exporter 1–2 each + the operator stream + the propagation dig-poll + the synthetic-UI probe) and subtract it explicitly from the a1 conns budget (critique G9/L9).
5.5 Candidate mitigations — ready experiments (do NOT pre-apply)
Staged so that if a hypothesis fires, we have a validated countermeasure to apply and re-measure (proving causation). None are baseline changes — the baseline must measure stock behaviour.
| Tag | Mitigation | Targets | Type | Notes |
|---|---|---|---|---|
| A | Batch operator mutations under one audit-lock acquisition; else move audit hashing off the commit path | H1 | Design | Security-critical; gate behind H1 firing. |
| B | Raise pool size/overflow (env); add PgBouncer/CNPG pooler (transaction mode) | H2 | Config+infra | Pooler is higher-leverage on single-node. |
| C | Coalesce dns_zone serial bumps to once-per-convergence-cycle; aggressive per-table autovacuum on dns_zone |
H3 | Code+config | Structural fix for hot-row contention; verify SOA monotonicity. |
| D | qlog-OFF posture; hourly prune; time-partition the log tables (prune = DROP PARTITION); ship firehose to Loki |
H4 | Config→schema | Highest-leverage criterion-(d) fix. |
| E | Per-table autovacuum tuning on dhcp_lease/ip_address/dns_zone/dns_record_op; raise global workers/cost_limit |
H5 | Config (restart) | Cheapest high-value tuning. |
| F | Webhooks-OFF baseline | H6 | Config | Only for the webhooks-ON profile. |
| G | (state, expires_at) composite index; cache subnet list once per sweep; batch/limit the sweep |
H8 | Schema+code | Removes the 5-min lock spike + speeds the lease-events preload SELECT. |
| H | Prune dns_record_op applied rows (new beat task deleting state='applied' older than a short window — none exists today) |
H5 (soak growth) | Code | Closes the verified unbounded-growth table. Strong candidate to ship regardless of test outcome. |
| I | COPY-based bulk insert for the log-entry endpoints (if the ingestion endpoint CPU becomes the limiter before the DB) | H4 (ingestion) | Code | Only if the endpoint, not autovacuum, is the limiter. |
6. Real-time monitoring / war-room
How we watch the 24h run live. The appliance ships no Prometheus/Grafana/ metrics-server/exporters, so the war-room is two pillars: (A) the native API JSON surfaces bridged into Grafana via ONE off-box JSON poller; (B) a deliberately-added, off-box-isolated Prometheus+Grafana + tightly-capped on-node exporters.
6.0 Design principle: never let the war-room become load
- Prometheus + Grafana run OFF the appliance (lg-0/monitoring VM). They pull; they never run on the SUT.
- Exporters that MUST run on the node (node-exporter, postgres_exporter, redis_exporter) are deployed with tight requests/limits (≤50m CPU / 64Mi each) and Burstable QoS so they evict before the SUT. Scrape targets only — cheap counter reads, no on-box aggregation.
- Scrape interval 15s steady soak / 10s in ceiling windows;
/health/platformat 5s. One dedicated JSON poller (one process, one superadmin token) — not N Grafana panels each hitting the API. pg_stat_statementsis a prerequisite baked into CNPGparameters+ restarted during provisioning, not the run.- Single-source-per-metric + 30s steady pg-catalog cadence (§5.4 observer discipline) so the war-room doesn’t contaminate criterion (a).
6.1 Metrics inventory (by layer)
Layer 1 — Load generators (client-side truth): DHCP offered-vs-achieved
DORA/s; DHCP ACK p50/95/99; DHCP drops/orphans/NAKs; DNS achieved-vs-offered QPS;
DNS resolve p50/95/99; DNS RCODE rates (incl. REFUSED=0, §4.8);
orchestrator lease→IPAM→DNS propagation lag; orchestrator API-mutation latency +
5xx. (The 60s native metric_sample floor is too coarse for the ceiling — these
client-side stats are the per-second truth. Pipe perfdhcp/dnsperf stdout through a
parser into the node-exporter textfile collector.)
Layer 2 — Services (Kea + BIND): Kea leases/sec, pool utilization,
declined/reclaimed, the DORA funnel (discover→offer→request→ack from
dhcp_metric_sample), status-get, memfile LFC pause (§3.6); BIND qps
(success/nxdomain/servfail/recursion), SERVFAIL rate, cache hit ratio, RRL
drops/slips (dns_metric_sample.rate_dropped/rate_slipped). (Both stats surfaces
are 127.0.0.1-only in-pod — native path is the agent → metric_sample → 60s
timeseries; add a kubectl exec scraper only if 60s proves too coarse.)
Layer 3 — Control plane (API + Celery + Redis): API request rate + p50/95/99 +
5xx per route; lease-events POST latency specifically (the leading indicator
of DB write-pressure); /health/platform dots + beat freshness;
Celery queue depth LLEN ipam/dns/dhcp/default (the canonical soak-backlog
signal — no native endpoint); Celery active/reserved + sweep_expired_leases
duration; Redis used_memory/maxmemory(256mb)/evicted_keys/ops/hit-ratio; Redis
wake-bus subscribers + publishes-by-class (DDNS wake-storm visibility).
Layer 4 — Database (the criterion-(a) panel): active conns vs 200 (but watch
the app-pool ceiling 30/process first); conns by state
(idle-in-transaction = the real pool-killer); cache_hit_ratio; longest txn; WAL
rate; per-table ins/upd/del + dead_tup + last_autovacuum; autovacuum_count +
dead-ratio over time; slow queries (pg_stat_statements); lock waits + deadlocks
(psql only); temp_files/temp_bytes; checkpoint frequency; pg_database_size
growth. Focus tables: the §5.4 set, with dns_record_op (no prune →
unbounded) watched closely.
Layer 5 — Host / container (attribution — “DB or just CPU?”): node CPU% per- core + load; node mem/swap; node disk IO (read/write/IOPS/await/%util) on the CNPG PV device; node disk free (root/var/CNPG PV) + 24h projection; node network rx/tx/drops; per-pod CPU/mem (cAdvisor via kubelet — metrics-server disabled); pod restarts/OOMKilled (KSM); CNPG working-set vs 1Gi.
Layer 6 — App domain counters: DNS qps / DHCP DORA over 24h (native 60s
timeseries — the diurnal overview); active lease count; IPAM auto_from_lease
count; dns_record count; dns_record_op pending/applied + total; agent
ring-buffer trim events; e2e propagation lag.
6.2 The Grafana war-room board
One board, top-to-bottom = “where it hurts first”. Every panel carries an explicit
“bad looks like”. Default refresh 15s; now-15m for ceiling, now-24h for soak.
Exporters to add (test infra): node-exporter (flip
observability.nodeExporter.enabled=true, values.yaml:167, + textfile collector
for perfdhcp/dnsperf); kube-state-metrics (flip …kubeStateMetrics.enabled=true,
values.yaml:149); postgres_exporter (minimal Deployment, dedicated read-only
pg_monitor role, + pg_stat_statements/pg_locks/deadlock custom queries);
redis_exporter (minimal Deployment, --check-keys=ipam,dns,dhcp,default for
queue LLEN); cAdvisor (no new pod — scrape kubelet /metrics/cadvisor); the
JSON poller (off-box, the native rollups).
| Row | Panels (source → “bad looks like”) |
|---|---|
| 0. SUMMARY ribbon | Platform dots (JSON ← /health/platform → any not green); DHCP achieved DORA/s (textfile → <90% offered); DNS achieved QPS (textfile → <90% offered); lease→DNS propagation p95 (JSON ← orchestrator → >12s); PG active conns/200 (pg_exp → >70% amber/>85% red); PG cache hit (pg_exp → <95% amber/<90% red); pod restarts last 1h (KSM → any = red); Redis used/256mb (redis_exp → >80% amber/evictions red) |
| 1. LOAD | DHCP offered vs achieved (textfile → diverge below offered); DHCP ACK p50/95/99 (textfile → p99 breaches SLO / tail blows out); DHCP drops/orphans/NAKs; DNS offered vs achieved + DNS resolve p50/95/99 (textfile → p99 > SLO, SERVFAIL climbing); orchestrator API-mutation latency + 5xx (JSON → 5xx>0, latency climbs with concurrency = audit-lock contention) |
| 2. SERVICE | Kea DORA funnel stacked (JSON → discover≫ack = dropping/pool empty); Kea pool util% (→ >90% device starvation not DB); Kea NAK/decline; BIND qps + cache hit (JSON → qps plateaus below offered; cache collapse); BIND SERVFAIL + RRL drops/slips (→ SERVFAIL climbing = starved; RRL = config cap not real ceiling) |
| 3. CONTROL PLANE | lease-events POST p50/95/99 (JSON/structlog → the leading DB-write-pressure indicator); Celery queue depth ipam/dns/dhcp/default (redis_exp → any monotonic climb = criterion d); Celery active + sweep duration (→ approaching 300s = overlap/lock storm); Redis ops/used/evicted (→ evictions>0); Redis wake-bus subscribers + publishes/sec (→ surge spike = DDNS wake-storm) |
| 4. DATABASE | D1 conns by state stacked (idle-in-tx climbing); D2 active vs 200 vs inferred app-pool ceiling (annotation at 30×replicas) (plateau at pool line = pool saturation); D3 cache-hit + temp_bytes (spills); D4 per-table dead-ratio + last_autovacuum age (ramp without reset = autovacuum losing); D5 per-table size growth (dns_record_op monotonic, no prune); D6 lock waits + deadlocks/sec (any deadlock; sustained lock-wait > 0); D7 inferred app-pool saturation (composite: api latency rising + conns flat below 200 + lease-events latency spiking); D8 WAL rate + checkpoints; D9 top slow queries (the per-zone DNSRecord N+1 / sweep subnet scan rising); D10 longest-txn age |
| 5. HOST | node CPU per-core + load (pinned cores → “DB slow” may be bind/kea starvation); node disk %util/IOPS/await on CNPG PV (pegged 100% = disk bottleneck); node disk free + 24h projection; node mem + swap (swap-in>0 = overcommit); per-pod CPU/mem (CNPG working-set→1Gi); pod restarts/OOM (any = soak fail); node net + drops |
6.3 The JSON poller (bridging native surfaces)
A ~150-line Python sidecar (or prometheus-json-exporter) running off-box on
the monitoring VM, one process, one superadmin token, polling and re-exposing as
Prometheus gauges:
5s :   GET /health/platform                          → spatium_platform_component_up{component}
15s:   GET /admin/postgres/overview                  → spatium_pg_{active_connections,max_connections,
                                                         cache_hit_ratio,wal_bytes,longest_txn_age_s,db_size_bytes}
       GET /admin/postgres/connections               → spatium_pg_conns_by_state{state}
       GET /admin/postgres/tables                     → spatium_pg_table_{dead_tup,live_tup,last_autovacuum_age_s,bytes}{table}
       GET /admin/redis/overview                      → spatium_redis_{used_memory,evicted_keys,ops_per_sec,hit_ratio}
       GET /admin/redis/wake-bus                      → spatium_wakebus_{subscribers,publishes_total{class}}
60s:   GET /metrics/dns/timeseries?window=1h          → spatium_dns_{qps,servfail,nxdomain}
       GET /metrics/dhcp/timeseries?window=1h         → spatium_dhcp_{discover,offer,request,ack,nak}_rate
Note (§5.4 discipline): the JSON poller is the source for the product rollups (platform dots, wake-bus, timeseries) only — the deep DB series (locks, deadlocks, per-table tuples, slow-queries) come from **postgres_exporter
- the direct psql poller**, NOT the
/admin/postgres/*path (which goes through the api pool + CNPG). This avoids double-loading the backend under test.
6.4 Deployment without disturbing the SUT
Off-box: Prometheus (24h+ retention, 15s scrape, --web.enable-admin-api so
the end-of-run TSDB snapshot works, §8.2.1), Grafana, the JSON poller. On-node
(tight limits + Burstable): node-exporter (20m/64Mi), KSM (20m/64Mi),
postgres_exporter (30m/64Mi, pg_monitor role), redis_exporter (20m/64Mi),
cAdvisor (no new pod). Total added on-node ≤ ~110m CPU / ~256Mi.
6.5 Live test-watch thresholds
“WE FOUND THE CEILING — stop ramping, record the number” (c): DHCP/DNS achieved/offered < 90% sustained 60s; DHCP ACK p99 / DNS resolve p99 > SLO; lease-events POST p95 > 1s (the headline DB ceiling); PG active conns plateau at the app-pool line while latency climbs (D7); Kea pool util > 95% (raise pool, not a real ceiling); BIND RRL drops > 0 (raise cap, not a real ceiling).
“BACK OFF NOW — about to crash” (protect the run): PG conns > 85% of 200; PG idle-in-tx > 20 climbing; any deadlock; PG cache hit < 85%; node disk %util pegged 100% > 30s; disk-free projection crosses zero before run end; any Redis evicted_keys; Redis used > 90%; Celery queue depth climbing monotonically > 5 min; sweep duration > 240s (80% of cadence); any agent ring-buffer trim; any pod restart/OOM; pod working-set > 90% of limit.
“SOAK INTEGRITY” (24h trend checks at t0/6/12/18/24h): per-table dead-ratio
climbing each cycle without reset; dns_record_op monotonic growth;
dhcp_lease_history on a disk-full slope; Redis used_memory creep; any pod RSS
creep; Celery inter-trough floor drifting up; the daily prune dead-tuple burst
reclaimed.
6.6 Terminal live status fallback
A single watch-style script (spatium-warroom.sh) for SSH-from-the-couch
monitoring, run from the monitoring box, refreshing every 5s, deps curl jq
kubectl redis-cli psql. Shows in one screen: PLATFORM dots; POSTGRES conns/max +
cache + longest-txn + by-state; hottest-table dead/live + last-autovacuum;
locks_waiting / deadlocks / idle_in_txn (psql, the only path); REDIS
mem/evicted/ops + the 4 queue LLENs; KEA/BIND last-60s funnel; COUNTS
active_leases / ipam_mirror / dns_records / record_op_pending (propagation
completeness + the unbounded dns_record_op check). Placeholders (<redis-pod>,
$REDISPASS, CNPG primary pod name, the exact native JSON field names) pinned
against the live API during provisioning (response schemas in
admin/postgres.py, admin/redis.py, metrics/router.py, health.py:270).
7. 24h bake-in harness & orchestration
The control plane for the test itself: a thin crash-tolerant controller on a separate load-gen box conducting off-box generators, a manifest-driven phase engine, a checkpointed run directory, the clean-appliance lifecycle, and three-layer safety guardrails.
7.0 Design summary
- Two-tier runner. A thin durable
spddi-perfcontroller (one process on lg-0, never on the appliance) owns the lifecycle: provision → seed → t0 baseline → ramp → steady → peak → soak → drain → collect → teardown. It drives worker generators (perfdhcp shards, dnsperf/flamethrower, the diurnal orchestrator) via a setpoint bus and supervises them. No protocol I/O — it is a conductor + watchdog + checkpointer. - Generators NEVER on the appliance (§2.3) — co-locating contaminates every criterion.
- The primary ramp dimension is control-plane write pressure (lease-events +
DDNS fan-out), not raw perfdhcp
-r— the ceiling is a DB/ingestion ceiling. - Manifest-driven + checkpointed to disk —
run-manifest.yamlcaptures every knob; the controller writesstate.json+ append-only NDJSON continuously so a crash is recoverable and partial results survive. - Guardrails first-class — kill-switch + hard max-rate caps + abort-if- unhealthy watchdog (throttle-before-abort).
7.1 Runner architecture + the setpoint bus
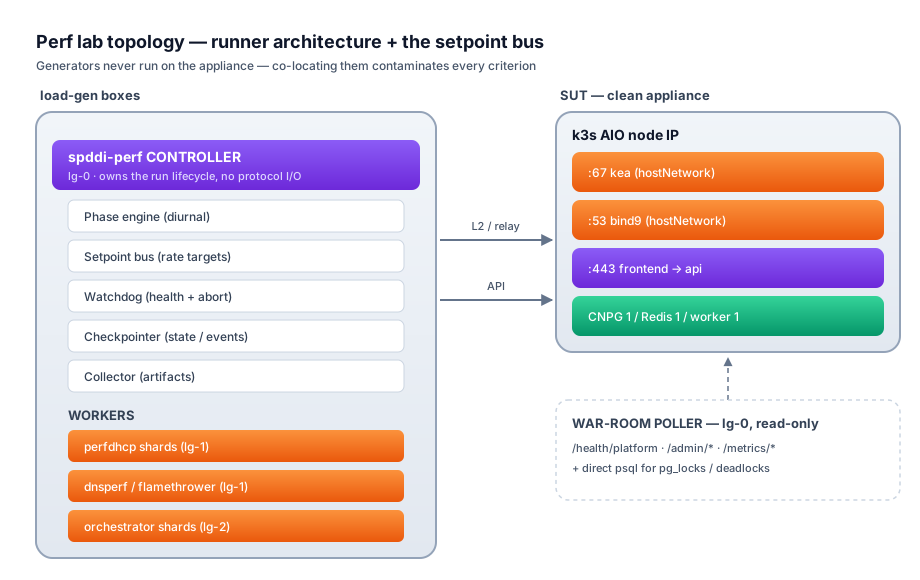
Setpoint bus. The diurnal curve is sampled on a 60s tick (matched to the
appliance’s native 60s metric buckets), publishing a setpoint record to
run/<run_id>/setpoints/current.json (+ append history.ndjson):
{
  "ts": "2026-07-01T08:00:00Z", "tick": 481, "phase": "peak",
  "dhcp": { "new_dora_per_s": 12.5, "renew_per_s": 161, "active_devices": 145000 },
  "dns":  { "qps": 18000, "nxdomain_frac": 0.02 },
  "ddns_enabled": true, "query_log_enabled": false,
  "operator_mutation_per_s": 3
}
The orchestrator is the source of truth for the curve (it owns the per-device
FSMs and internally produces staggered arrivals/DORA/T1/T2/query bursts); the
controller publishes phase + global multipliers; perfdhcp/dnsperf top up raw
protocol throughput to find the floor. Lockstep: all workers read the same
current.json keyed by tick; a worker reading a stale tick logs setpoint_lag
(the watchdog surfaces it — a leading indicator the load-gen box is saturating, so
we don’t mistake generator saturation for SUT saturation).
7.2 Phase engine
| Phase | Default duration | Setpoint | Primary criteria |
|---|---|---|---|
provision |
pre-run | none | — |
seed |
minutes | none | — |
baseline_t0 |
10 min | idle (beat-only background) | (a)(d) reference floor |
ramp |
75 min | linear 0 → steady | (b)(c) |
steady |
210 min | flat “busy day” rates | (a)(b)(d) SLO baseline |
surge_ramp |
30 min | steady → peak (08:00 storm) | (b)(c) renewal storm |
peak |
75 min | peak, then probe beyond | (c) — first-to-give |
soak |
900 min (fills 24h) | diurnal-modulated | (d) — incl. daily prune window + overnight sweep + fault-injection mini-phase (§7.6.6) |
drain |
15 min | rates → 0; wait for dns_record_op pending→0 + zone-state gap→0 (§7.6.7) | (d) clean final snapshot |
collect |
minutes | none | — |
Smoke variant (--profile smoke): same engine/schema, compressed (~40 min,
2–5k devices) — the CI/dev confidence check + capacity calibration + baseline
tuning (§1.9). It must hit every phase transition and artifact path.
7.3 The run manifest (reproducibility)
One YAML, single source of truth; the controller stamps a resolved copy into the artifact bundle. Regenerated from §0.A canonical numbers (critique A1–A5/D2):
# perf/manifests/university-24h.yaml
schema_version: 1
run: { name: university-24h, profile: full,
       notes: "250k-device diurnal soak, relay topology, DDNS on, qlog off, operator stream on" }

target:
  node_ip: 10.20.0.10
  api_base: https://10.20.0.10/api
  dhcp: { port: 67, topology: relay,          # relay | broadcast (Phase-0 decision)
          giaddr: [10.20.0.1, 10.20.0.2, 10.20.0.3, 10.20.0.4,   # 8 — one per subnet
                   10.20.0.5, 10.20.0.6, 10.20.0.7, 10.20.0.8] }
  dns:  { port: 53, driver: bind9, recursion: false }
  appliance: { expected_version: ">=2026.06.19-1",   # loose pin — record, don't ==-gate (L3)
               cnpg_instances: 1, redis_kind: sentinel-single }

scale:                       # ALL from §0.A
  unique_devices: 250000
  peak_active_devices: 150000
  students: 50000
  lease_time_s: 7200         # 2h headline; T1=900s HARDCODED (NOT lease/2) — confirm Phase 0
  ddns_enabled: true
  query_log_enabled: false
  operator_mutation_stream: { enabled: true, sustained_per_s: 3, burst_per_s: 50 }

seed:
  ip_block: 10.0.0.0/8
  subnets: { count: 8, prefix: 16, pool_fraction: 0.90 }
  dns:
    forward_zones: ["campus.example.edu"]
    reverse_zone_shape: per-octet         # per-octet | single  (§0.A; per-octet headline)
    reverse_zones: ["0.10.in-addr.arpa", "1.10.in-addr.arpa", ...]   # 8 octets
  statics: 0                              # leases auto-mirror; do NOT pre-seed addresses
  relay_addresses_per_scope: true         # seeder sets relay.ip-addresses=[giaddr_i] per subnet

diurnal:                     # §1.3 hourly weights (0..1 of peak)
  arrival_weights: [0.05,0.03,0.02,0.02,0.03,0.10,0.45,0.95,1.00,0.85,0.80,0.82,
                    0.85,0.80,0.78,0.75,0.70,0.65,0.55,0.45,0.35,0.25,0.15,0.08]
  dns_qps_sustained_peak: 18000           # the curve value (NOT the burst ceiling)
  dns_qps_burst_ceiling: 120000           # raw-protocol resperf/dnsperf target only
  dora_per_s_peak: 12.5

phases:
  - {name: baseline_t0, minutes: 10,  load: idle}
  - {name: ramp,        minutes: 75,  load: ramp,  from: idle, to: steady}
  - {name: steady,      minutes: 210, load: steady}
  - {name: surge_ramp,  minutes: 30,  load: ramp,  from: steady, to: peak}
  - {name: peak,        minutes: 75,  load: peak,  probe_ceiling: true}
  - {name: soak,        minutes: 900, load: diurnal, fault_injection: true}
  - {name: drain,       minutes: 15,  load: ramp,  from: steady, to: idle, wait_convergence: true}

slo:                         # [tune-after-baseline] — see §8.3
  slo_thresholds_version: v1-proposed
  dhcp_ack_p99_ms: 50
  dns_resolve_p99_ms: 20
  lease_to_ipam_to_dns_p95_s: 10
  api_5xx_rate_max: 0.005

guardrails:
  kill_switch_file: run/STOP
  max_dora_per_s: 400
  max_dns_qps: 150000
  max_lease_events_per_s: 400
  watchdog:
    poll_interval_s: 5
    abort_on:
      health_platform_component_down: true
      pg_connections_pct_of_max: 0.95
      pg_longest_txn_s: 120
      redis_used_memory_pct: 0.90
      celery_queue_depth: 50000
    throttle_before_abort: true

observability:
  superadmin_token_env: SPDDI_PERF_ADMIN_TOKEN   # token lifetime >= run length (§7.6.6)
  psql_dsn_env: SPDDI_PERF_PSQL_DSN              # direct psql for pg_locks/deadlocks
  enable_pg_stat_statements: true               # MUST be on pre-run
  poll: { health_platform_s: 5, postgres_overview_s: 15, postgres_tables_s: 30,
          redis_overview_s: 15, metrics_timeseries_s: 60, psql_locks_s: 30 }

disk_budget:                 # §7.6.3 — pre-computed, sizes the test VM disk
  est_24h_gb: 28
  required_pv_gb: 64
Variant manifests (regenerated from §0.A):
smoke.yaml,firehose-soak.yaml(query_log_enabled: true, bounded qps),audit-contention.yaml(ramps the operator stream to its own ceiling),single-reverse-zone.yaml(H3 hot-row stress),realistic-lease.yaml/stale-row-soak.yaml(86400 lease),300k-ceiling.yaml.
7.4 Checkpointing & durability
run_id = <UTC-start>-<manifest.name>-<short-uuid>.
perf/run/<run_id>/
  manifest.resolved.yaml        # exact knobs (all values pinned)
  state.json                    # phase/tick/since — atomic write-temp-then-rename
  events.ndjson                 # phase transitions, throttles, aborts, warnings
  setpoints/{current.json,history.ndjson}
  snapshots/{t0_baseline,t+6h,t+12h,t+18h,prune-pre,prune-post,ceiling,final}.json
  warroom/{health_platform,pg_overview,pg_connections,pg_tables,pg_slow_queries,
           pg_locks,redis_overview,redis_wakebus,celery_queues,metrics_dns,metrics_dhcp}.ndjson
  generators/{perfdhcp.shardN.stat, dnsperf.stat, orchestrator.shardN.ndjson, lifecycle.ndjson}
  logs/{controller.log, worker.<name>.log}
  report/{summary.md, criteria.json}
Atomicity + recovery: state.json write-temp-then-rename; all time-series
append-only NDJSON with a leading UTC ts (partial-line truncation loses at most
the last record); --resume <run_id> reads state.json and continues from the
recorded tick (the curve is a pure function of tick — deterministic resumption);
the war-room poller + worker stat writers persist independently of the
controller, so even an unrecoverable controller crash leaves a usable dataset.
7.5 Clean-appliance lifecycle
Provision + verify (§7.5.1):
- Boot a clean appliance (best from a known-good VM snapshot reverted before each
run; the runner asserts booted version vs
target.appliance.expected_versionloosely —>=or record-only, not==, so a release bump doesn’t break every run). - Enable
pg_stat_statementsbefore any load (CNPGparameters+ restart +CREATE EXTENSION; assert/admin/postgres/slow-queriesreturnsavailable:true). The runner refuses to start load if requested-but-unavailable. - Enable DNS/DHCP roles on the AIO node via Fleet (the supervisor schedules
bind9+kea + injects per-role agent keys into
role-compose.env, zero key-paste). - Verify agents healthy: poll
/health/platformuntil all green; confirm exactly one bind9 + one kea server row registered andactive. - Phase-0 unknown-confirmation gates (§9 Phase 0): dump rendered
kea-dhcp4.conf(assertrenew-timer:900) +named.conf(assertrecursion no;); confirmmax_connections; confirmdns_recordhard-delete; lock the DHCP topology. - Pre-flight safety + sync gates: in-lab NTP up; clock-skew offset < 50ms on all boxes; recursion-leak probe (out-of-zone → local REFUSED, no upstream round-trip); egress watch (zero outbound :53); in-zone coverage probe (sample query-set names resolve NOERROR/AA).
Seed the scaffold (§5.2 seeder, NOT scripts/seed_demo.py): 1 space + 1 block;
N large subnets (cheap, ~3 placeholder rows each); 1 DHCP group + scope(s) + large
dynamic pool(s) (~90%); set relay.ip-addresses=[giaddr_i] per scope if relay;
DNS group + forward zone(s) + matching reverse zone(s) per reverse_zone_shape;
do NOT pre-seed addresses. Bulk-load the large authoritative dataset (§4.9
Layer 1). Write seed-manifest.json recording exactly what was created.
War-room poller (read-only sidecar, §6): started at provision, runs the whole
lifecycle, polls native surfaces + direct psql, appends to warroom/*.ndjson,
degrades gracefully (an available:false endpoint is recorded, not fatal), never
mutates the SUT.
Snapshots: t0 baseline (end of baseline_t0, full read of every war-room
surface + pg_stat_user_tables for the hot tables + bloat — the reference floor);
periodic deep snapshots every 6h + bracketing the daily prune tick; final (after
drain + convergence) — the leak/bloat/backlog verdict is final vs t0.
Collect + teardown: pull worker stat files; generate report/; no
auto-destroy (operator post-mortem); log the revert recipe; stop the poller +
lingering workers. The kill-switch + watchdog leave the box recoverable even on
abort.
7.6 Safety / guardrails
7.6.1 Kill-switch — run/STOP sentinel (every worker + controller checks each
tick → ramp-to-zero + graceful stop + final snapshot); SIGINT/SIGTERM to the
controller does the same; orphan workers self-terminate if current.json goes
stale (fail safe to off, never full blast).
7.6.2 Hard max-rate caps — guardrails.max_* clamp every published rate so a
manifest typo or runaway ramp can never DoS the appliance NIC before the
interesting (DB) ceiling is found.
7.6.3 Disk-space budget (pre-computed, critique B2). Disk-full mid-soak is unrecoverable, not a graceful ceiling. Pre-compute per profile and size the test VM disk before boot:
| Table (24h, headline qlog-off) | Driver | Est. growth |
|---|---|---|
dhcp_lease_history |
one row per expiry, 90d retention (grows all run) | ~few GB at 250k churn |
dns_record_op |
~35M rows/day, NO prune | measure bytes/row early × projected count (§8 d7) |
dns_record |
~2× active DDNS leases | ~bounded |
| WAL | write-amp proxy | bracket-monitored |
dns_query_log_entry |
~360M wide rows/day | qlog-on profile only — could fill disk before the first prune; size the PV accordingly or shorten retention |
The manifest carries disk_budget.{est_24h_gb, required_pv_gb}; provisioning sizes
the VM/PV to it. “Back off when disk projection crosses zero” is a reaction; this
is the plan.
7.6.4 Abort-if-unhealthy watchdog (throttle-before-abort). Polls war-room
surfaces every 5s, evaluates abort_on (health-platform component down; PG conns ≥
95%; PG longest-txn ≥ 120s; Redis used ≥ 90%; Celery queue ≥ 50000; api 5xx ≥ SLO).
On first breach it backs off one phase (re-publishes the previous lower
setpoint) and logs watchdog_throttle, giving the box a chance to recover (e.g.
autovacuum catches up). Only on a sustained breach does it abort (ramp-to-
zero, final snapshot, stop) — so ceiling discovery is safe. The aborted run is
still a result: the watchdog writes the breaching surface’s full sample + the
triggering setpoint into events.ndjson + snapshots/ceiling.json.
Generator-saturation detection — also watches load-gen-side health
(setpoint_lag, perfdhcp/dnsperf send-side drops, load-gen box CPU). If
generators can’t deliver the setpoint, the run is flagged generator-bound, not
SUT-bound (the operational answer to the perfdhcp-cardinality open risk).
7.6.5 SUT-failure taxonomy + response (critique B7). The watchdog protects the box from the load; this covers the box failing on its own:
| Class | Examples | Harness response |
|---|---|---|
| Transient blip | api pod restart that recovers; brief health-platform flap; CNPG failover-less hiccup that self-clears within grace | Pause setpoints → wait for /health/ready → resume from tick → annotate events.ndjson (sut_blip). The run continues; the report flags the window. |
| Hard failure | CNPG OOM (single-instance = no failover); Redis flush/restart (loses broker + wake-bus + sessions → criterion-d integrity gone); appliance reboot that doesn’t recover within grace; disk-full | Abort → preserve evidence (final + snapshots/ceiling.json) → mark run INVALID (not FAIL) → log recovery recipe (revert VM snapshot, re-run). 14h of bake lost is a re-run decision, not a verdict. |
7.6.6 Deliberate fault-injection mini-phase (criterion #5 reconnection + non-
negotiable #5 cached-config operation). Inside the overnight soak, a short
window that deliberately exercises agent/supervisor reconnection under churn:
- Restart an agent container (kill bind9 or kea) → assert the daemon re-joins (PSK→JWT bootstrap, or 401/404 re-bootstrap) and reconverges; assert no IPAM/DNS correctness loss.
- Sever control-plane connectivity for N seconds (firewall the agent’s path to
the api) → assert bind9/kea keep serving from last-known-good cache
(
/var/lib/spatium-{dns,dhcp}-agent/, non-negotiable #5), then re-converge cleanly when restored. - Test JWT rotation under load — the heartbeat mints a new JWT on
needs_rotation; assert the agent rotates without dropping ingestion. The poller + orchestrator hold superadmin/agent tokens for the full 24h — token lifetime must be ≥ run length (or auto-refresh), else the run dies at the expiry hour for nothing. HTTPS calls useverify=False/ pinned self-signed cert.
7.6.7 Confounder + drain discipline. Query logging OFF for throughput runs (a
dedicated firehose-on variant tests ingestion-vs-prune). Integrations/webhooks OFF
for baseline (a separate variant measures their cost). The operator-mutation
stream is ON in the headline (§1.6) so criterion (a)’s lock dimension is
answered; an audit-contention variant ramps it to its own ceiling. Test-time
beat/feature posture checklist (provisioning-owned, critique B3): leave the
~30 integration/whois/cert/backup beats OFF; webhooks OFF; conformity/device-
profiling OFF; document which beats stay on (health/alerts/sweep). The daily
prune_log_entries fires run_every=24h from worker boot, not at a wall-clock
time (critique d-ii) — in a fresh-boot 24h run it may fire after tEnd, so the
harness must trigger the prune manually at a chosen in-window time (a “kick the
prune now” Celery-task hook the seeder/harness exposes) OR boot the appliance long
enough before t0 that it fires mid-run OR shorten retention for the test. Drain
convergence gate (critique G6): drain waits for dns_record_op pending → 0 and
the zone-state gap → 0 before the final snapshot, so pending-but-unapplied ops
don’t read as false-positive backlog.
7.6.8 Synthetic human-UI probe (critique B8). A low-rate “human” probe timed
through the run with its own latency/5xx SLO, separate from the operator-mutation
stream: representative authenticated page-loads / heavy N+1 list endpoints
(GET /ipam/subnets, the dashboard rollup, a DNS zone’s records list). Answers the
brief’s explicit question — can an admin open the Dashboard at surge peak without a
30s spinner or a 502, on a 30-connection app pool already shared by the war-room +
orchestrator + operator stream?
7.6.9 Per-pod limit headroom (critique B5). Pre-state expected peak working-set
vs limit so “OOM = surprise” becomes “OOM = predicted-and-bounded”: worker (lim
2Gi/2CPU — runs the 02:00 audit_chain_verify whole-table materialization, whose
RSS scales with audit_log size; the operator stream at 2–5/s × 24h = ~170k–430k
rows — bound whether that OOMs in the limit); CNPG (lim 1Gi, shared_buffers 256MB —
working-set creep); api (lim 512Mi, 30-conn pool).
8. Metrics collection & end-of-run reporting (SLO pass/fail)
§6 builds the live war-room. §8 closes the loop on the result: what we collect/freeze/export at tEnd, the consolidated SLO table (the single gate for all four criteria — owned here), the run-report artifact, and a regression- comparison mode so future releases gate against a stored baseline.
8.0 Design principles
- The report is the deliverable, not the dashboards. A run-id’d directory of raw data + a rendered report that survives the test VMs being torn down.
- Measure the thing under load from OUTSIDE it. All end-of-run aggregation +
percentile computation + chart rendering happen off-box. The product’s own
metric_sample//admin/*are corroborating (recorded for cross-check); the authoritative numbers come from external Prometheus + the generators’ client-side stats. Rationale §8.6. - Freeze, don’t sample-at-the-end. Continuous time-series (Prometheus) + bracketing snapshots (pg_stat_statements, bloat, row counts).
- Every SLO row maps to exactly one collected metric and one stored artifact.
- Defensible-but-provisional thresholds — every latency/leak number is
[tune-after-baseline]; the smoke run replaces them and flipsslo_thresholds_version v1-proposed → v2-measured(§1.9, §10).
8.1 The run-id’d artifact directory
RUN_ID = <UTC-start>_<git-sha>_<profile> where <profile> =
{short-lease|realistic-lease}-ddns-{on|off}-qlog-{on|off}[-300k] — because the
dominant write table flips with the profile (short lease → dhcp_lease UPDATE
churn; long lease + qlog-on → dns_query_log_entry volume), a result is only
meaningful relative to its profile and regression comparison must be like-for-like.
runs/<RUN_ID>/
├── manifest.json # run identity & provenance (§8.1.1)
├── prometheus/{snapshot/, promql-extracts/}
├── snapshots/{t0,t6,t12,t18,prune-pre,prune-post,tEnd}/
│ pg_stat_user_tables.csv, pg_stat_statements.csv (reset@t0), pg_stat_database.csv,
│ table_index_bloat.csv, table_index_sizes.csv, row_counts.csv,
│ settings.csv (SHOW ALL), rendered_kea.conf, rendered_named.conf, disk_free.csv
├── generators/{perfdhcp/, dnsperf-resperf/, flamethrower/,
│ orchestrator/{timeseries.jsonl, summary.json, dhcp_latency_hist.hdr,
│ dns_latency_hist.hdr, propagation_lag.csv}}
├── native/{health_platform.jsonl, metric_sample_dns.csv, metric_sample_dhcp.csv,
│ admin_postgres_redis.jsonl}
├── psql-poll/psql_metrics.csv
├── logs/{agent_buffer_trims.log, pod_restarts.log, annotations.csv}
├── report/{report.md, report.html, report.pdf, slo_results.json, charts/}
└── baseline -> ../<BASELINE_RUN_ID>
8.1.1 manifest.json provenance — run_id, started/ended UTC, git_sha +
release_tag, appliance facts (cpu/ram/disk, cnpg_instances, shared_buffers,
work_mem, resolved max_connections, autovacuum_overrides, pg_stat_statements
on), the full profile (d_total, lease_seconds, t1_seconds: 900, ddns,
query_log_enabled, subnets, reverse_zone_shape, dns_recursion off, powerdns,
dnssec, operator_mutation_stream, webhooks), load_gen (boxes, tool versions),
mitigations_applied (empty for a baseline), section1_curve_version,
slo_thresholds_version. **Provenance also captures the rendered kea-dhcp4.conf
named.conf** (critique D1) so a re-run on a drifted image is detectable. The manifest is the regression-comparison key — §8.5 refuses to compare profiles that differ on the load-bearing axes.
8.2 What gets collected & exported at tEnd
8.2.1 Prometheus time-series — the continuous record. At tEnd take a TSDB
admin snapshot via the off-box Prometheus at
http://<monitoring-vm>:9090/api/v1/admin/tsdb/snapshot (requires
--web.enable-admin-api, §6.4 — this is Prometheus’s own admin API, NOT a
SpatiumDDI endpoint, critique H5). Also run a fixed set of PromQL extracts into
flat CSVs (promql-extracts/) so the report renders standalone: Load (client
truth — dhcp/dns offered/achieved/p50/95/99, RCODE incl. REFUSED, propagation lag,
api mutation p95, 5xx); DB (active conns, conns-by-state, cache-hit, longest-txn,
WAL/s, deadlocks, locks-waiting, temp-bytes, per-table dead-ratio/size/last-
autovacuum-age, db-size, pg_stat_statements top-20); Control plane (lease-events
p95, queue depth per queue, sweep duration, redis used/evicted/ops, wakebus
publishes); Host (node cpu/load/disk-util/await/free/mem/swap/net-drops, container
cpu/working-set, pod restarts); Domain truth (active leases, ipam mirror,
dns_record, dns_record_op pending/total). Series names mirror §6’s exporter names.
8.2.2 pg_stat_statements + bloat + autovacuum (t0↔tEnd delta). pg_stat_
statements_reset() at t0, full dump at tEnd by total_exec_time + mean_exec_time —
the delta is the run’s query profile (predicted top: lease-events bulk-preload
SELECT, the per-zone SELECT dns_record WHERE zone_id N+1, the dns_zone serial
UPDATE, the daily prune DELETE, and qlog-on the dns_query_log_entry INSERT).
Bloat via pgstattuple at t0/6/12/18/prune-pre/prune-post/tEnd for the focus tables
(a monotonic climb that never resets = criterion-(d) bloat failure). Autovacuum
from pg_stat_user_tables snapshots — the headline: did n_dead_tup oscillate
(good) or ramp (autovacuum losing)?
8.2.3 Per-generator latency histograms. The percentile truth lives in the
generators (Prometheus sees only periodic summary gauges). Preserve full-fidelity
HdrHistograms: dhcp_latency_hist.hdr (DORA + renewal, full-run + per-phase so
“peak p99” is exact); dns_latency_hist.hdr (resolve, split by name-class);
propagation_lag.csv (the orchestrator’s t_resolve − t_lease samples — the
criterion-(b) headline number no protocol tool can produce).
8.2.4 Domain-truth row counts (correctness + completeness). A run can hit every latency SLO and still be wrong if the agent dropped events. The propagation-completeness ledger at every bracket:
| Count | Query | Proves |
|---|---|---|
| active leases | count(*) from dhcp_lease where state='active' |
tracks the diurnal occupancy curve; flat-lining while load climbs = ingestion drop |
| dhcp_lease total vs distinct active IPs | count(*) from dhcp_lease vs count(distinct ip_address) |
orphan accumulation under MAC churn (no unique constraint, §3.6) |
| IPAM mirror | count(*) from ip_address where auto_from_lease |
lease→IPAM completeness; gap vs active leases = mirror behind |
| DNS records | count(*) from dns_record where deleted_at is null |
lease→DNS completeness; ≈ 2× DDNS-enabled active leases |
| record_op total | count(*) from dns_record_op |
unbounded-growth check (no prune task — §5 H/mitigation H) |
| record_op pending | count(*) from dns_record_op where state='pending' |
DDNS apply backlog |
| lease history | count(*) from dhcp_lease_history |
fastest-growing table |
| audit rows | count(*) from audit_log |
0 from device load + only operator-stream rows (H1 scoping proof) |
| DDNS short-circuit ratio | generator-emitted wrote-vs-short-circuited on renewals | ~0% on renewals required (H3) — else the ceiling collapses |
Cross-checked against the generator’s own counts (unique MACs, total DORA, total first-DDNS) so any discrepancy is a named correctness finding.
8.2.5 Container resource peaks + restart ledger (cAdvisor + KSM) — peak + final working-set + CPU per pod, full restart/OOM ledger (a criterion-(d) hard gate).
8.2.6 Queue-depth + agent-buffer-trim time-series — per queue: peak depth,
time-to-drain after each diurnal peak, inter-trough baseline drift (creeping floor
= worker losing ground); agent_buffer_trims.log first-trim timestamp (the
unambiguous ingestion-ceiling event).
8.3 The consolidated SLO table (pass/fail per criterion)
This is the gate. Each row: metric → source → threshold → verdict rule.
[tune-after-baseline]= principled starting point re-derived from the smoke idle floor before the 24h run treats it as a gate. Verdicts computed mechanically intoreport/slo_results.json. Profile-conditional rows marked ⚑.
Criterion (a) — DB never bottlenecks
| # | SLO | Source | PASS | Verdict |
|---|---|---|---|---|
| a1 | Peak PG active conns vs 200 (minus observer overhead, §5.4) | postgres_exporter | < 70% (140) | peak < threshold |
| a2 | App-pool saturation (inferred, D7) | composite: lease-events p95 rising while pg conns flat below 30×api-replicas | never all-true | no sustained (>60s) co-occurrence |
| a3 | idle-in-transaction | pg_conns_by_state | < 10, not climbing [tune] |
peak < 10 AND tEnd ≈ t0 |
| a4 | Deadlocks | psql pg_stat_database | exactly 0 | any increment = FAIL |
| a5 | Lock-wait waiters | pg_locks (granted=false) | no sustained > 0 | no window > 30s with waiters > 0 |
| a6 | Cache hit ratio | pg_cache_hit_ratio | ≥ 95% steady / ≥ 90% floor [tune] |
min over steady ≥ 90% |
| a7 | Autovacuum keeping up | per-table dead-ratio trajectory | oscillates, no monotonic ramp | no focus table strictly increasing |
| a8 | dns_zone hot-row contention (H3) |
n_tup_upd + dead_tup + lock-wait on dns_zone |
no lock-wave at first-DDNS peak; reclaimed each cycle | no sustained lock-wait on dns_zone |
| a9 | temp_files / spill | pg_temp_bytes/s | no large sustained spill [tune] |
bounded (work_mem=16MB context) |
| a10 | WAL rate | pg_wal_bytes/s | bounded, correlates with load | no decoupled growth |
| a11 | audit_log device-load isolation |
audit_row_count delta | 0 from device load | device-only sub-windows write 0 audit rows |
| a12 ⚑ | Daily log-prune DELETE (qlog-on) | prune duration + bloat prune-pre↔post | completes; bloat reclaimed in-window | DELETE finishes; autovacuum reclaims before tEnd |
Criterion (b) — End-to-end latency SLOs [tune-after-baseline], per phase
| # | SLO | Source | PASS | Verdict |
|---|---|---|---|---|
| b1 | DHCP ACK p50 (DORA) | HdrHistogram | < 10 ms on-LAN | steady p50 < threshold |
| b2 | DHCP ACK p99 (DORA) | HdrHistogram | < 50 ms steady / < 250 ms peak | per-phase p99 < per-phase threshold |
| b3 | DHCP renewal p99 | HdrHistogram (separate) | < 30 ms steady | steady p99 < threshold |
| b4 | DNS resolve p99 (auth, UDP, on-LAN) | dnsperf / orchestrator | < 10 ms steady | steady p99 < threshold |
| b5 | DNS resolve p999 / max | dnsperf | < 50 / < 200 ms | tail bounded |
| b6 | DNS SERVFAIL rate | client + metric_sample.servfail | < 0.1% steady | < threshold |
| b6a | DNS REFUSED rate | client RCODE | exactly 0 | any REFUSED = out-of-zone query-set bug/leak (§4.9) |
| b7 | DNS timeout/drop rate | client | ~0 steady | no sustained timeouts |
| b8 | lease→IPAM→DNS propagation p95 (phase-aware) | propagation_lag.csv | < 10 s (5–12s budget) | p95 < threshold per phase |
| b9 | propagation p99 | propagation_lag.csv | < 12 s | p99 < ceiling of budget |
| b10 | zone-state convergence gap | last_serial − reported_serial |
returns to 0; never unbounded | gap bounded, converges each plateau |
| b11 | lease-events POST p95 (write-pressure SLO) | lease_events_post_p95 | < 500 ms steady / < 1 s peak | per-phase p95 < threshold |
| b12 | API mutation p95 (operator stream) | orchestrator timing | < 1 s; 5xx = 0 | p95 < 1s AND zero 5xx |
| b13 | Synthetic-UI human-usability p95 (§7.6.8) | UI probe timing | page-load p95 < [tune]; 5xx = 0 | admin can drive the UI at peak |
Criterion (c) — Max sustainable throughput (discovery, not fixed pass/fail)
| # | Reported | Source | Determined by |
|---|---|---|---|
| c1 | Max sustainable lease-events/sec | dhcp_achieved + lease_events_post_p95 + trim log | offered rate just below the first of: b11 breach / lease_events_buffer_trimmed / an (a) breach |
| c2 | Max sustainable DNS qps | dns_achieved vs offered (resperf) | qps where achieved diverges >10% OR b4 breaches OR SERVFAIL>0.1% |
| c3 | First-to-give component (conditioned on profile) | all panels at breach | the component whose saturation fired first (qlog-OFF headline: predicted #2 dns_zone hot-row, since qlog ingestion #1 can’t fire) |
| c4 | DHCP protocol headroom | perfdhcp ceiling | confirms Kea ACK ceiling ≫ control-plane ceiling |
| c5 | DNS protocol headroom | resperf ramp at idle DB | confirms BIND answer-rate ≫ realistic load |
| c6 | Saturation graceful vs catastrophic | latency curve at breach | PASS = smooth degrade before any 5xx/restart/drop; FAIL = cliff |
| c7 ⚑ | Audit-lock ceiling (audit-contention variant) | operator-stream ramp | the committed-mutations/sec plateau = 1/mean-audited-txn-hold-time (H1) |
Verdict rule (c): PASS if c4+c5 confirm the ceiling is the control-plane/DB tier (not protocol), AND c6 is graceful, AND c3 is identified with evidence. c1/c2 are recorded as the release’s documented capacity (this run creates the baseline, no prior art to gate against).
Criterion (d) — 24h soak stability
| # | SLO | Source | PASS | Verdict |
|---|---|---|---|---|
| d1 | Pod restarts / OOMKills | KSM, pod_restarts.log | exactly 0 | any = FAIL |
| d2 | Memory leak (per-pod RSS) | container_working_set | flat (tEnd ≈ first-steady-plateau ± 15%) [tune] |
no monotonic slope after warm-up |
| d3 | CNPG working-set vs 1Gi | cAdvisor | < 90%, no creep | peak < 90% AND no trend |
| d4 | Celery queue returns to baseline | celery_queue_depth | drains to ~0 between peaks; flat trough-floor | no rising trough-floor |
| d5 | Redis memory + evictions | redis_used, redis_evicted | evicted=0; used flat | any eviction = FAIL |
| d6 | Bloat bounded (per hot table) | table_index_bloat trajectory | no unbounded growth; reclaimed | no focus table strictly increasing t0→tEnd |
| d7 | dns_record_op growth |
dns_record_op_total + measured bytes/row × projection vs PVC free | documented (no prune); FAIL if it threatens disk before a horizon | report slope + 24h total; FAIL if projection crosses PVC |
| d8 | Disk free (root/var/CNPG PV) | node_disk_free | trajectory ≥ 0; ≥ 20% free at tEnd | steepest-slope projection stays positive |
| d9 ⚑ | Log-prune keeps tables bounded (qlog-on) | log row count across the prune | post-prune drops; not net-growing day-over-day | prune reduces count; no net accumulation |
| d10 | Agent ring-buffer trims | agent_buffer_trims.log | 0 at steady/soak (trims allowed only in the deliberate ceiling-push) | any trim outside the c-window = FAIL |
| d11 ⚑ | audit_chain_verify 02:00 worker RSS |
container_working_set{worker}@02:00 | no OOM | survives the verify with the audit-stream-grown table |
| d12 | Platform heartbeat continuity | health_platform.jsonl | all dots green 24h (excl. the deliberate fault-injection window) | no unexpected component-down |
| d13 | Agent cached-config operation (fault-injection, §7.6.6) | orchestrator + agent logs | bind9/kea keep serving from cache during the severed-connectivity window; reconverge cleanly | no correctness loss; clean re-join |
8.3.1 Threshold provenance. DHCP ACK p50<10ms / p99<50ms, DNS resolve p99<10ms
are on-LAN authoritative (recursion OFF; Kea memfile in-memory) — both servers
answer from RAM with no DB on the hot path; single-digit-ms is the right order on a
quiet LAN; the peak p99<250ms allowance reflects queueing under the surge.
Propagation p95<10s / p99<12s is the recon budget (5s agent batch + wake +
nsupdate) — phase-aware because the batch-fill time is ~0.6–1.9s at peak (count
trigger) but 5s at trough (timer). lease-events POST p95<500ms/<1s must stay well
below the agent’s 5s flush cadence or the buffer starts filling. conns<70%,
deadlocks=0, REFUSED=0, cache-hit≥90%, evictions=0, restarts=0 are structural
invariants — not relaxed after baseline. The [tune-after-baseline] tags sit on
the latency magnitudes and leak/spill tolerances; the smoke run replaces them
with idle-floor × 3 (latency) / idle ±15% (leak) and flips
slo_thresholds_version v1-proposed → v2-measured.
8.4 The run report artifact
report/report.md (+ .html with embedded charts, + optional .pdf) generated
off-box from the run directory; slo_results.json is the machine-readable twin.
Structure:
- Executive verdict (one glance):
RUN 20260701T000000Z_89262d2_short-lease-ddns-on-qlog-off (250k, 2h lease, T1=900s, DDNS on, operator stream on) ─────────────────────────────────────────────────────────────────────────── (a) DB never bottlenecks ...... PASS (peak conns 41%, 0 deadlocks, autovacuum kept up, audit-isolation proven) (b) Latency SLOs ............... PASS (DHCP ACK p99 41ms; DNS p99 6ms; propagation p95 7.2s; REFUSED 0) (c) Max sustainable throughput CEILING FOUND (~290 lease-events/s; first-to-give: dns_zone hot-row; protocol headroom 12×) (d) 24h soak stability ......... FAIL (dns_record_op grew to 31M unbounded — no prune; disk-risk ~3.1d; all else green) ─────────────────────────────────────────────────────────────────────────── OVERALL: CONDITIONAL PASS — ship-blocking: dns_record_op prune (§5 mitigation H)(Numbers illustrative.)
- The SLO table (§8.3) with each row’s measured value next to its threshold, PASS/FAIL/N-A, link to the evidence chart.
- Annotated timeline charts — 24h overview with phase boundaries + operator
annotations: offered-vs-achieved DORA/qps; DHCP ACK + DNS resolve + propagation
p50/95/99 (with SLO lines); DB panel (conns-by-state + cache-hit + per-table
dead-ratio + deadlocks, annotating the 5-min sweep ticks + the daily prune);
soak panel (per-pod RSS + queue depth + Redis used +
dns_record_opcount); host panel (node CPU + disk %util/await + disk-free projection — the DB-vs-CPU-starvation attribution chart). - Bottleneck finding — the named component + evidence chain (which signal fired first, the chart, the pg_stat_statements row, the ready §5 mitigation A–I to validate next).
- t0↔tEnd delta tables — pg_stat_statements top-20, per-table size+bloat+ autovacuum-count delta, the §8.2.4 row-count ledger, disk-free delta, container peaks.
- Profile + provenance —
manifest.jsonrendered human-readably (self- describing) + the rendered kea/named configs. - Open questions surfaced by this run — auto-populated from any
[tune-after-baseline]thresholds exercised + the §5 dry-run validations the data can now answer (e.g. “DDNS short-circuit fired on 99.8% of renewals” — the load-bearing fact for the whole throughput story).
If aborted early, the generator emits a partial report flagged INCOMPLETE (a
crashed run is still evidence). slo_results.json is the contract for CI/release
gating (§8.5) — small, stable-schema, diffable in git.
8.5 Regression-comparison mode
make report RUN_ID=<new> BASELINE=<baseline>: (1) refuses incomparable
profiles (aborts if manifests differ on d_total, lease_seconds, t1_seconds,
ddns, query_log_enabled, subnets, reverse_zone_shape, powerdns,
dnssec); (2) diffs every SLO row with a regression band (default ±20% on
latency/throughput [tune] — a p99 that doubles 25→48ms is flagged
“REGRESSED (still within SLO)”); (3) compares the discovered ceiling (c1/c2);
(4) compares t0↔tEnd deltas (per-table bloat slope, dns_record_op slope,
pg_stat_statements top-query mean-time); (5) renders a side-by-side report.
Gate policy: Hard BLOCK = any criterion flips PASS→FAIL; any
deadlock/restart/eviction; ceiling drops > block-tolerance. WARN = within-SLO
degradation beyond the regression band; a [tune] threshold exercised for the
first time. slo_results.json + comparison.json are the only files CI needs —
a GitHub Actions job (or the release workflow) reads them and posts WARN/BLOCK on
the release PR, making the 24h soak a gateable artifact like make ci.
Baselines: the first clean run on a known-good release is promoted by copying
its RUN_ID into runs/BASELINE_<profile> (each profile its own baseline);
re-baseline deliberately (after a CNPG bump or a sanctioned mitigation landing),
never silently — mitigations_applied + git_sha make a baseline’s pedigree
explicit.
8.6 External Prometheus vs the product’s own surfaces
Authority is external because: (1) don’t perturb the SUT — the product
dashboards are served by the api pod querying CNPG (the two components under test);
at surge peak every dashboard refresh competes with lease-events for the 30-slot
pool. External Prometheus + off-box exporters add ≤~110m CPU / 256Mi of tightly-
capped, first-to-evict footprint and zero app-pool/CNPG-query load. (2)
resolution — metric_sample is 60s buckets (too coarse for the ceiling
inflection + the latency tail). (3) coverage — metric_sample carries only
DNS/DHCP protocol counters; it has nothing on connections, locks, deadlocks,
bloat, autovacuum, queue depth, pod RSS, disk-io, or client latency — most of the
SLO table. (4) survivability — if the api pod saturates/restarts (the failure
we’re hunting), native dashboards go dark exactly when we need the data; external
Prometheus keeps scraping straight off the kubelet + CNPG + Redis.
Native surfaces still collected (corroboration, not authority):
cross-validation (server’s own QPS vs client achieved-QPS — a gap = queries dropped
before BIND counts them, NIC/conntrack/kernel); /health/platform is the canary of
record (d12); and they are themselves under test (a product-quality finding —
do the dashboards stay usable, §7.6.8). The one place native is required:
pg_locks/deadlocks/WAL-rate/autovacuum-progress come from the direct psql
poller (off-box, dedicated pg_monitor role, its 1–2 conns baselined out of a1)
- postgres_exporter custom queries — the authoritative source for a4/a5/a8.
8.7 End-of-run freeze runbook
At tEnd (and the partial-run path if aborted), all from the monitoring VM:
- Stop generators cleanly; flush final summaries + HdrHistograms +
propagation_lag.csv. - tEnd snapshot batch (psql, off-box role): pg_stat_user_tables,
pg_stat_statements (both orderings), pg_stat_database, bloat, sizes, row counts,
SHOW ALL, rendered kea/named configs, disk-free →snapshots/tEnd/. - Prometheus TSDB admin snapshot →
prometheus/snapshot/; run the PromQL extract job. - Dump native timeseries (24h window); close out
health_platform.jsonl+ the JSON-poller archive. - Extract soak ledgers (
agent_buffer_trims.log,pod_restarts.log, finalizeannotations.csv). make report RUN_ID=<id> [BASELINE=<id>]→report.{md,html,pdf},slo_results.json,charts/,comparison.{html,json}.- Seal the directory (checksum manifest, optional tar, archive off the monitoring VM so it survives teardown).
Pre-run dependency (true at t0):
pg_stat_statementspreloaded +CREATE EXTENSION+pg_stat_statements_reset()at t0 with the t0 snapshot taken — else the t0↔tEnd query-profile delta is meaningless.
9. Repo layout + ordered build plan
9.1 Where the suite lives
A new top-level perf/ directory (sibling to backend/, agent/, appliance/,
scripts/) — a first-class component, self-contained, clearly not the shipped
product. NOT under backend/tests/ (that’s pytest unit/functional; the perf suite
is off-box, long-running, infra-touching). New make perf-* targets via
include perf/Makefile.inc.
perf/ # NEW top-level — load + soak test suite
README.md # how to run; box prereqs (perfdhcp/dnsperf install)
Makefile.inc # perf-* targets included by the root Makefile
harness/spddi_perf/
controller.py manifest.py phases.py setpoints.py checkpoint.py
watchdog.py workers.py collect.py cli.py # run|resume|smoke|status|stop
generators/
dhcp/{perfdhcp_shard.py, relay_templates/}
dns/{dnsperf_runner.py, flamethrower_runner.py, campus-qnames.txt, gen_dns_queryset.py}
orchestrator/{device_fleet.py, lifecycle_log.py, api_mutation_stream.py,
synthetic_ui_probe.py}
seeder/{seed_scaffold.py, fleet_enable.py, pgss_enable.py, trigger_prune.py}
warroom/{poller.py, psql_probe.py, surfaces.py, spatium-warroom.sh}
manifests/{university-24h.yaml, smoke.yaml, firehose-soak.yaml, audit-contention.yaml,
single-reverse-zone.yaml, realistic-lease.yaml, 300k-ceiling.yaml}
dashboards/{grafana/{provisioning/, dashboards/*.json}, prometheus/prometheus.yml,
exporters/{postgres_exporter.yaml, redis_exporter.yaml}}
reports/{<run_id>/summary.md, template.md.j2}
run/ # gitignored — live run state + artifacts
.gitignore
Makefile targets (mirroring the appliance-* block): perf-smoke,
perf-run, perf-resume RUN_ID=, perf-seed MANIFEST=, perf-warroom,
perf-collect, perf-stop RUN_ID=, perf-report RUN_ID= [BASELINE=]. Uses
python3 (host has no bare python).
Conventions honored: structured JSON logs (timestamp/level/service/
request_id, non-negotiable #7); artifact filenames carry UTC timestamps; no
secrets in the manifest (token + psql DSN referenced by env-var name, non-
negotiable #6); run/ gitignored; manifests//harness//generators//seeder//
warroom//dashboards/ + rendered reports/<run_id>/ committed for
reproducibility.
9.2 Ordered, phased BUILD PLAN
Build sequence with the critical path and a minimum-smoke-capable milestone. The risky long pole is the asyncio orchestrator holding 250–300k device FSMs over raw sockets (Phase 4) — everything before it is comparatively cheap.
Phase 0 — verify the unknowns (BLOCKS all number-finalization). Boot a clean
appliance; confirm and record: renew-timer:900 (dump rendered kea-dhcp4.conf);
recursion no; (dump rendered named.conf); actual CNPG max_connections;
dns_record hard-DELETE; lock the DHCP topology (relay vs broadcast); enable
pg_stat_statements. Run the perfdhcp 300k-MAC cardinality experiment (max
stable clients/proc on box spec Y → shard count). Go/no-go: the canonical numbers
(§0.A) and the topology are confirmed before anything is built to them.
Phase 1 — seeder + fleet-enable + pg_stat_statements (perf/seeder/).
Scaffold (space/block/subnets/pool/group/zones, manifest-sized; relay_addresses
per scope if relay; bulk-load the large authoritative dataset); enable DNS/DHCP
roles + verify agents healthy; assert/enable pg_stat_statements; the
trigger_prune hook. Cheapest, unblocks everything.
Phase 2 — war-room poller + psql probe + off-box Prom/Graf (perf/warroom/ +
perf/dashboards/). The native poller, the psql lock/deadlock probe, the off-box
Prometheus (--web.enable-admin-api) + Grafana board + on-node exporters. So you
can see anything. Set up the in-lab NTP server + the clock-skew gate.
Phase 3 — protocol floors (perf/generators/{dhcp,dns}/). perfdhcp shard
wrapper (MAC-range shard, rate from setpoint, relay templates if relay) +
dnsperf/resperf/flamethrower runners + the query-set generator (gen_dns_queryset.py
with the in-zone validator, §4.9). Validate the box answers; get the protocol
ceiling; validate perfdhcp 300k-MAC cardinality before building the
orchestrator.
Phase 4 — the orchestrator (perf/generators/orchestrator/) — the long
pole. Device FSM (raw-socket byte templates, the 900s renew contract, the
RENEWING-re-requests-current-lease rule, §3.2/H3), diurnal scheduler, propagation-
lag dig-poll probe, lifecycle.ndjson. Build + smoke-validate scheduler lag at
scale (the go/no-go for whether one box holds the device count).
Phase 5 — operator-mutation + synthetic-UI streams
(api_mutation_stream.py, synthetic_ui_probe.py). Audit-lock contention (H1) +
human-usability (b13).
Phase 6 — controller / phase-engine / watchdog / checkpoint (perf/harness/).
Ties it together; can be stubbed earlier to drive smoke runs. Includes the
SUT-failure taxonomy + fault-injection mini-phase + drain-convergence gate.
Phase 7 — report generator + regression gate (perf/harness/collect.py +
reports/template.md.j2). Runs off-box after freeze; emits report.* +
slo_results.json + comparison.*.
Then:
- Smoke run (the gated predecessor, §1.9) — validate end-to-end; calibrate
generator capacity (compute shard/box counts); baseline-tune thresholds
(flip
slo_thresholds_version v1-proposed → v2-measured); confirm the manual prune path. The 24h run does not start until the smoke passes its go/no-go. - 24h headline run (
university-24h.yaml: 250k, 2h lease, DDNS on, qlog off, 8 per-octet reverse zones, operator stream on, relay or broadcast per Phase 0). - Variant runs (as wall-clock allows):
firehose-soak(qlog-on prune path),audit-contention(ramp the operator stream to its ceiling),single-reverse-zone(H3 stress),stale-row-soak(24h lease),300k-ceiling.
Minimum smoke-capable milestone: Phases 1 + 2 + 3 + a stubbed Phase 6
controller + a minimal Phase 4 orchestrator (single shard, small device count) —
enough to run perf-smoke end-to-end and prove every phase transition + artifact
path.
9.3 Interactive TUI console (spddi-perf tui) — implemented
Shipped alongside the headless suite: an interactive rich console modeled on the
appliance’s Talos-style console dashboard, acting as a read-write conductor
over the harness (perf/harness/spddi_perf/tui/; run via make perf-tui or
python3 -m spddi_perf.cli tui). It is the interactive evolution of the read-only
§6.6 spatium-warroom.sh — it adds control, not a new control path: Start shells
out to spddi_perf.cli run, Stop trips the kill-switch file, Abort terminates the
controller process, and the dashboard reads the same run-dir artifacts the headless
path writes (state.json, setpoints/current.json, warroom/*.ndjson,
events.ndjson, generators/*.ndjson). --render-once renders a single frame
without a TTY (testing/screenshots).
Delivered scope:
- Manifest picker + pre-flight gate checklist — choose a manifest, then show the §9 Phase-0 + §4.9 safety probes (renew-timer:900, recursion no;, NTP skew, recursion-leak, in-zone coverage, disk budget) as green/amber/red chips; block Start until the gates pass.
- F-key control strip (mirroring the appliance console): F1 Start · F2
Throttle · F3 Trigger-prune · F4 Resume · F5 Stop (kill-switch) · F6 Abort — each
destructive key opens an arrow-key confirm modal defaulting to No (the
appliance console’s
ConfirmModalpattern) so a careless Enter can’t fire a run. - Live phase ribbon — current phase, T+ test-clock, and the live setpoint (DORA/s · renew/s · lease-events/s · DNS qps · online), refresh-on-tick.
- War-room vitals panes — sourced from the
warroom/*.ndjsontails +state.json- generator
*.ndjson: PG conns/cache/locks/deadlocks, Redis, Celery queue depth, the §8.2.4 domain-counts ledger, generator achieved-vs-offered + p99s — each colour-coded against the §6.5 live test-watch thresholds.
- generator
- Event + watchdog pane — tails
events.ndjson; renders the watchdog throttle/abort banner prominently. - Built on
rich(Live+ a tick loop) like the appliance console; runs off-box on lg-0/the monitoring VM. Lands as atuisubcommand inperf/harness/spddi_perf/cli.py- a
perf/harness/spddi_perf/tui/package, reusing the war-roomsurfaces.pyfield mappings so it never drifts from the headless poller.
- a
10. Open questions for the operator
These are decisions the operator must make (or confirm) before the suite is built or the 24h run starts. Items resolved by the critique pass are marked [resolved in this plan].
D_totalheadline. Plan designs to 250k + 300k as a separate ceiling cut. Confirm, or run both as separate 24h cuts (doubles wall-clock).- DNS sustained peak (18k qps). Declared a stated input (busy-hour sustained authoritative qps) — validate against any real campus resolver stats you can supply; validate the ~120k burst ceiling against BIND’s measured single-node answer rate in the smoke run. [resolved: 18k is an input, not derived twice]
- Lease time. Headline 2h (T1=900s hardcoded, NOT lease/2); 1h ceiling lever; 24h stale-row-soak variant. Confirm the headline value. [resolved as a profile axis]
- DHCP topology — relay/giaddr vs direct-broadcast. Phase-0 decision;
relay needs the seeder to set
relay.ip-addressesper scope + an 8-entry giaddr list + one perfdhcp shard per giaddr. Confirm the load-gen box can populate per-subnet giaddr, or accept single-VLAN broadcast for v1. [fully specified; decision still needed] - perfdhcp / orchestrator capacity at 250–300k. The smoke run owns the capacity calibration + a hard go/no-go gate (the 24h run won’t start until the fleet sustains the surge peak). Confirm acceptable. [resolved as a gated smoke step]
- Reverse-zone shape. Headline 8 per-octet (spreads PTR serial-bump
contention); single
10.in-addr.arpais a labeled H3 hot-row-stress variant. Confirm. [resolved as a profile axis] - Operator-mutation stream in the headline. Folded into the headline at 2–5/s so criterion (a)’s lock dimension is answered in one cut; an audit-contention variant ramps it to its ceiling. Confirm. [resolved]
- Query-log firehose sub-run. Bounded ~5k qps for ~3h (the only safe way to
exercise
dns_query_log_entryingestion + the daily prune without the catastrophic ~1.5B-row full run). Confirm it’s wanted, and that the prune-tick timing question (it firesrun_every=24hfrom boot, may land after tEnd) is handled by the manual-prune trigger the harness exposes. Confirm. pg_stat_statementsenablement requires a CNPG restart during provisioning (bake into the test appliance’s CNPG params vs runtime-patch the Cluster CR). Confirm acceptable on the test appliance. [resolved as a Phase-0/provisioning step]- Run start time. Plan assumes start at local 00:00 so the surge lands T+7..T+8 and the prune/recovery T+21..T+24. Confirm, or accept a phase-shifted curve.
- In-lab NTP inside the egress-blocked VLAN. The §4.9 egress block conflicts with internet NTP; an in-lab NTP source + a clock-skew pre-flight gate (offset < 50ms) resolves it. Confirm the lab can host an in-VLAN NTP server. [resolved as a hard pre-flight; operator provides the source]
- Test VM disk size. The per-profile disk budget (§7.6.3) sizes the test VM/PV before boot (qlog-on could fill disk before the first prune). Confirm the operator can provision the required PV size.
dns_record_opdisk-risk (d7). The table never prunes; the run will show monotonic growth. Decide: FAIL (ship-blocking, forces §5 mitigation H) or a documented WARN for this release? The architectural reality (no prune task) argues FAIL — and mitigation H (prune applied ops) is a strong candidate to ship regardless of the test outcome.- bind9 vs powerdns + DNSSEC. Headline driver = bind9; PowerDNS/DNSSEC explicitly deferred to a separate effort. Confirm. [resolved]
- Regression gate policy. Default ±20% on latency/throughput for WARN, PASS→FAIL flip for BLOCK. Confirm the tolerance and whether the release process wants a hard CI BLOCK or advisory WARN on a perf regression.
- Report format + perf-history. Confirm whether a signed-off
.pdfis needed and whetherslo_results.jsonshould be git-committed per release (a tracked perf-history) or kept as a CI artifact only. - Profile matrix scope. Each profile needs its own promoted baseline (you
can’t compare across profiles). Confirm which get a full 24h cut (at minimum:
short-lease-ddns-on-qlog-offas the realistic default;…-qlog-onfirehose stress; the 300k stretch ceiling cut) — this multiplies wall-clock and storage. - Whether to ship §5 mitigation H (prune applied
dns_record_op) regardless of the test outcome. Low-risk (applied ops are terminal, agents never re-read them); closes a verified unbounded-growth table.